 Featured Play
Charts
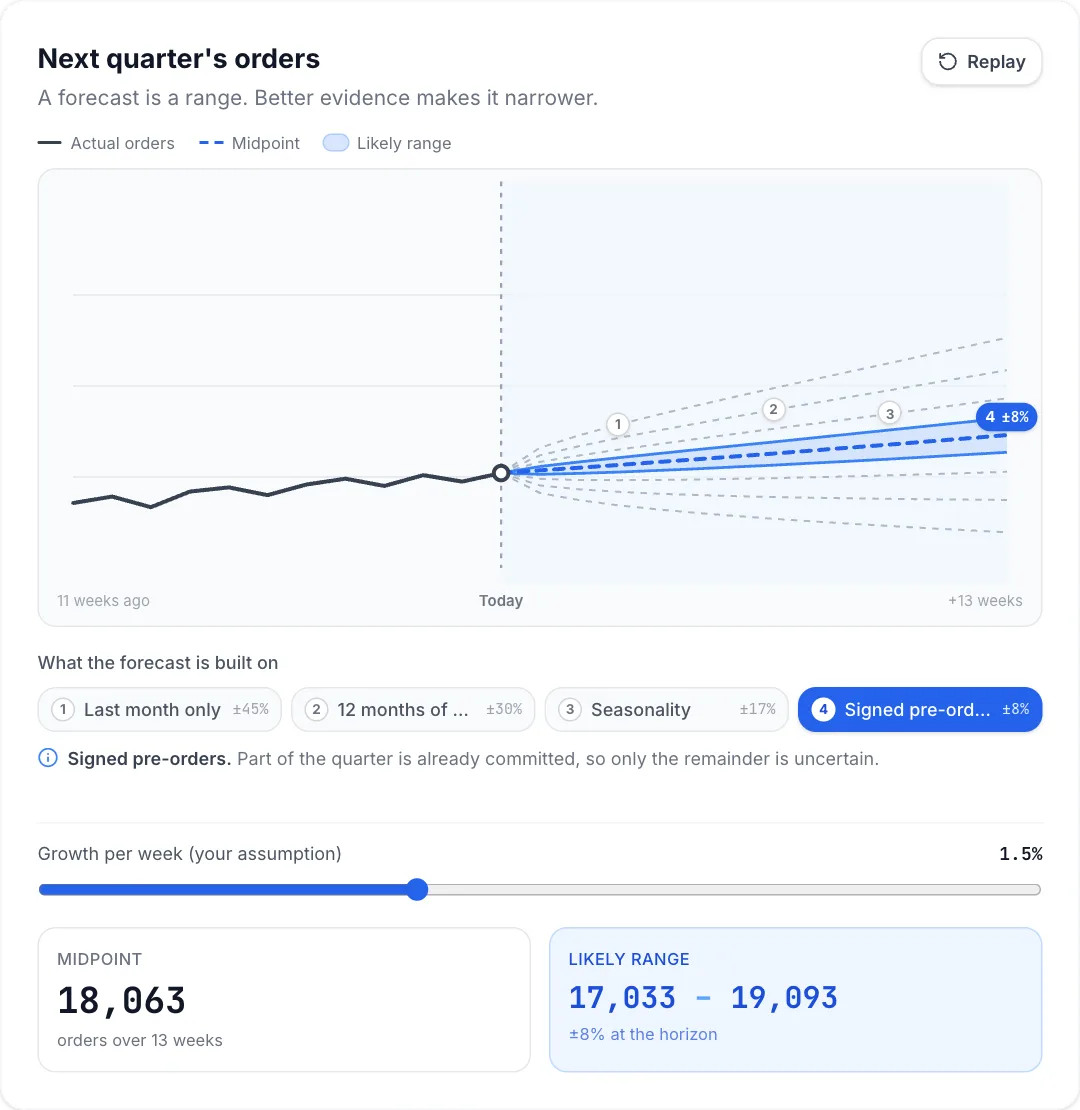
Forecast cone
A demand forecast drawn as a widening cone that narrows step by step as the evidence improves, from last month only to signed pre-orders, with the quarter's likely range underneath.
Animated demos, explainers and website components people made from their own screenshots, sites and ideas. Play one, then make one like it about your product.
Interactive pieces from the component marketplace: data stories, product demos and website sections, each playing live. Open one to use it on your site or make one like it about your product.
Featured PlayA demand forecast drawn as a widening cone that narrows step by step as the evidence improves, from last month only to signed pre-orders, with the quarter's likely range underneath.
 Featured Play
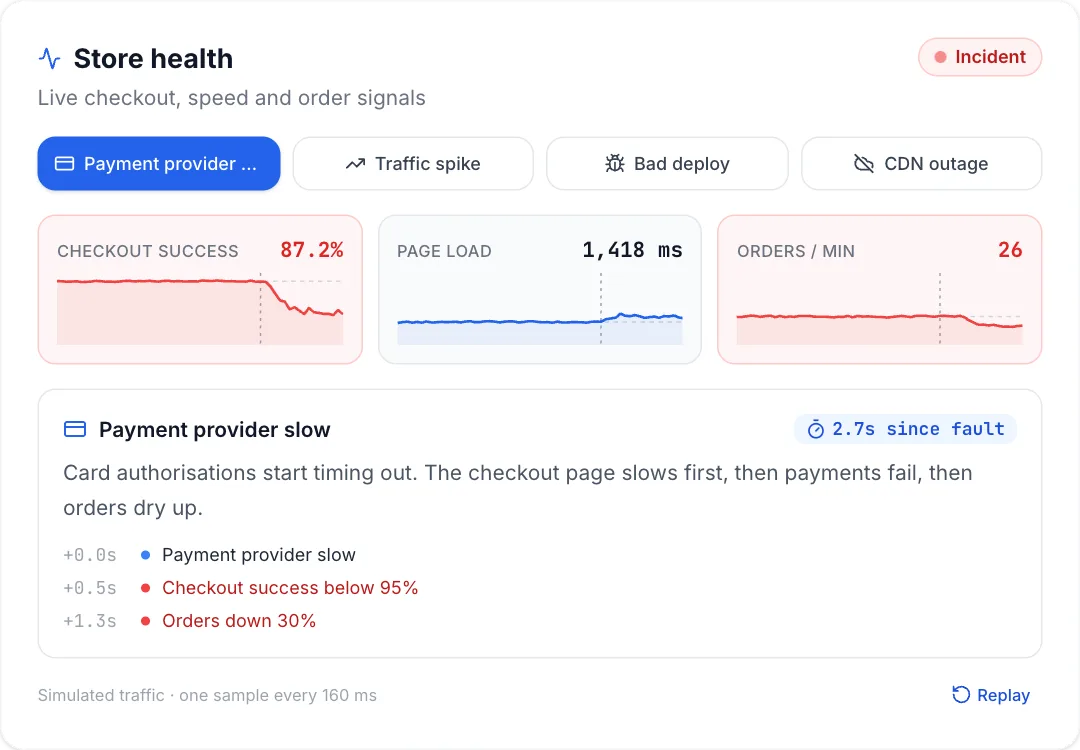
Live store health sparklines where an injected fault ripples through checkout success, page load and orders per minute in sequence, a since-fault timer runs and the store recovers.
 Featured Play
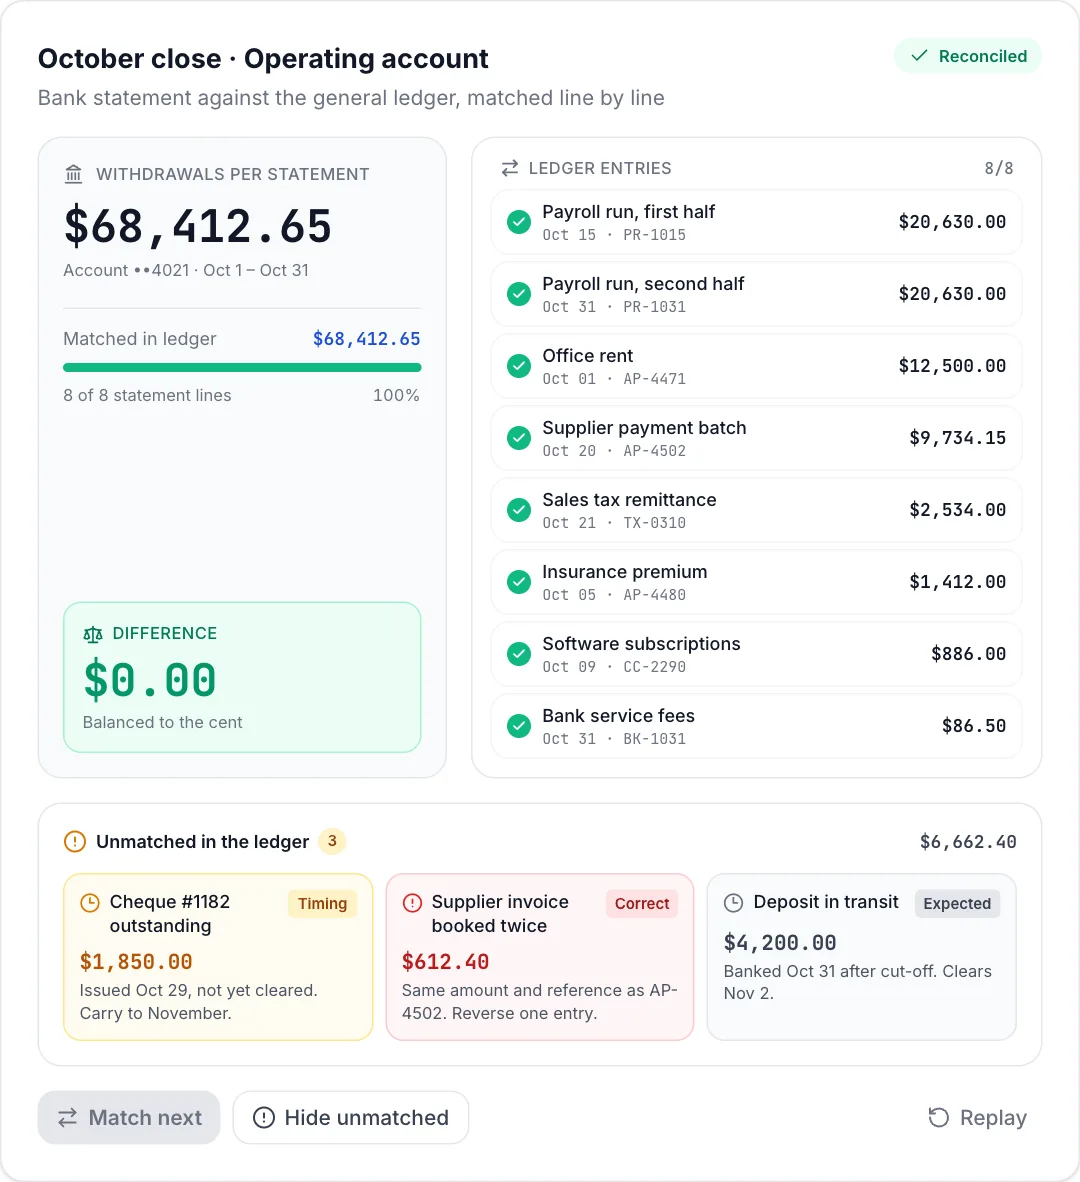
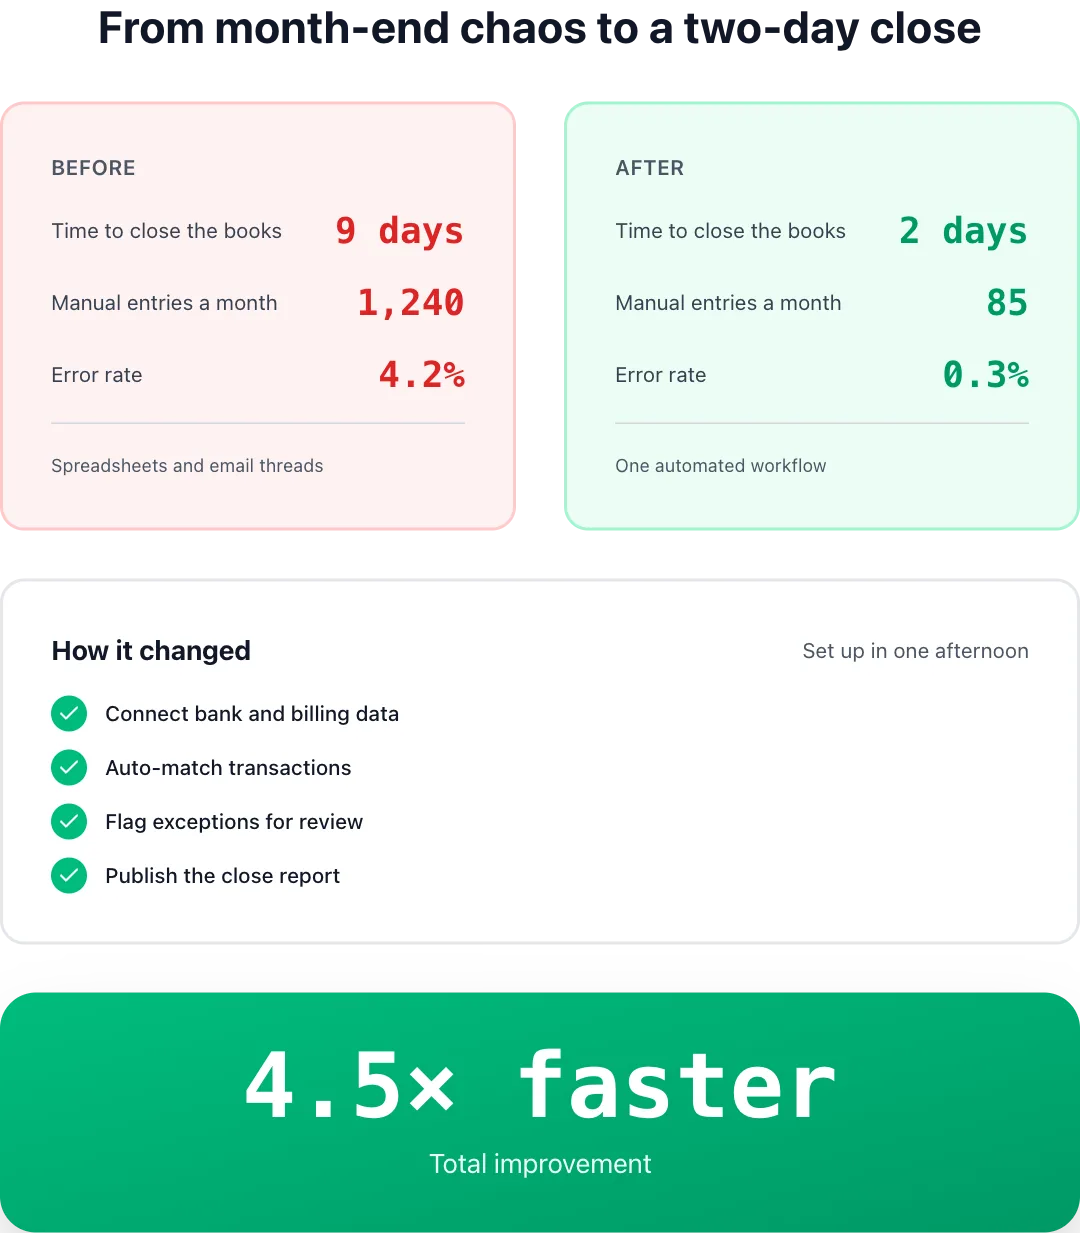
A month-end bank reconciliation where ledger entries match the statement one by one until the difference eases to exactly 0.00, then the items that matched nothing are revealed.
 Featured Play
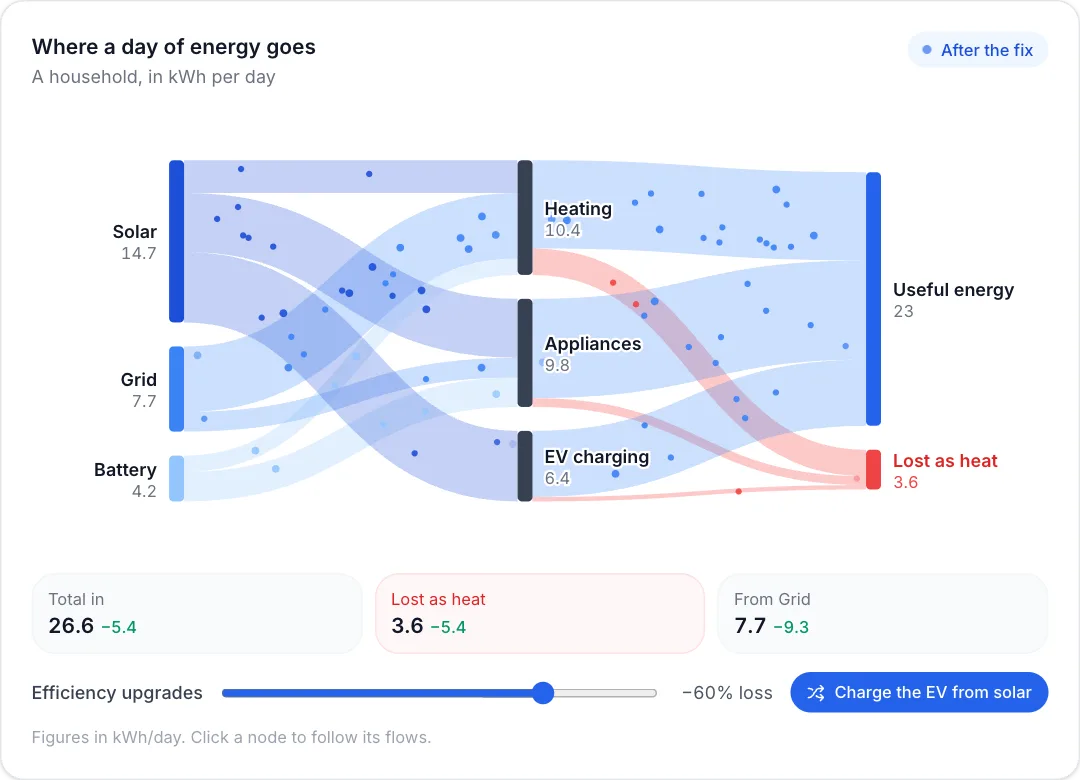
An animated where-it-goes flow: particles ride each ribbon, a red loss ribbon shrinks as a slider moves, and one flow re-routes with a click.
 Featured Play
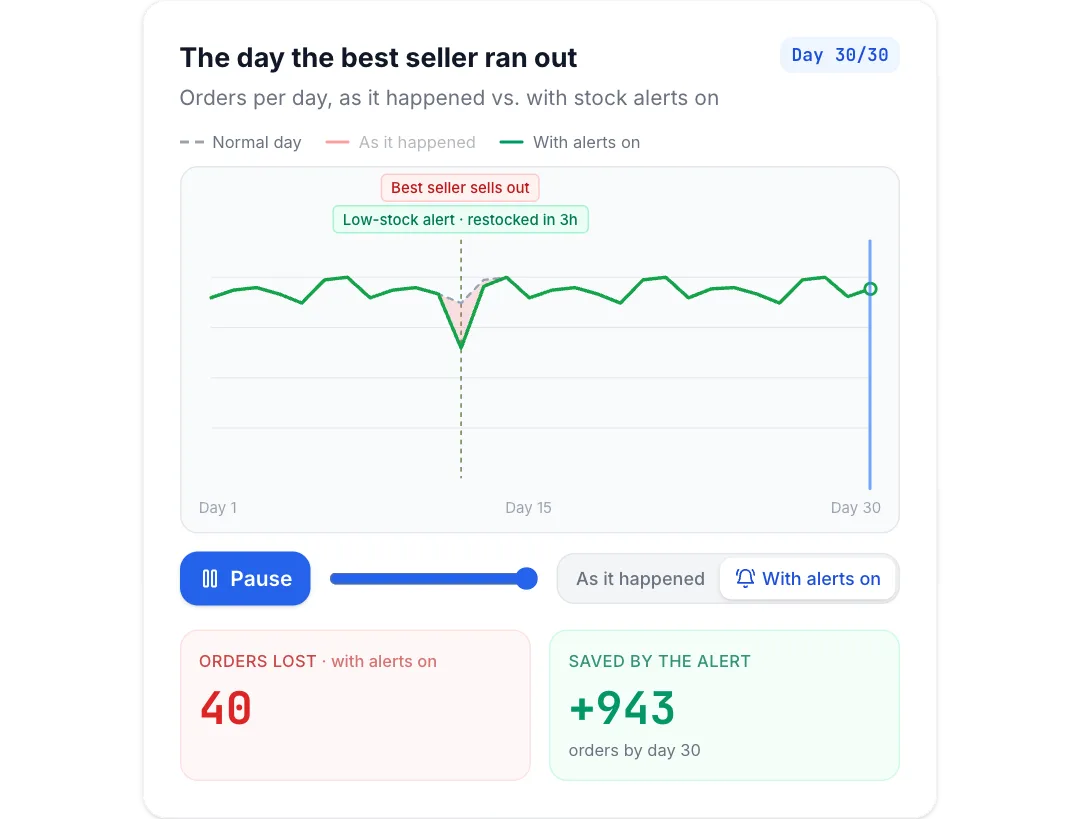
A 30-day series that plays itself: the gap below a normal day fills in red with a running loss counter, then the 'caught it in hours' history closes the gap. Play, scrub and toggle histories.
 Play
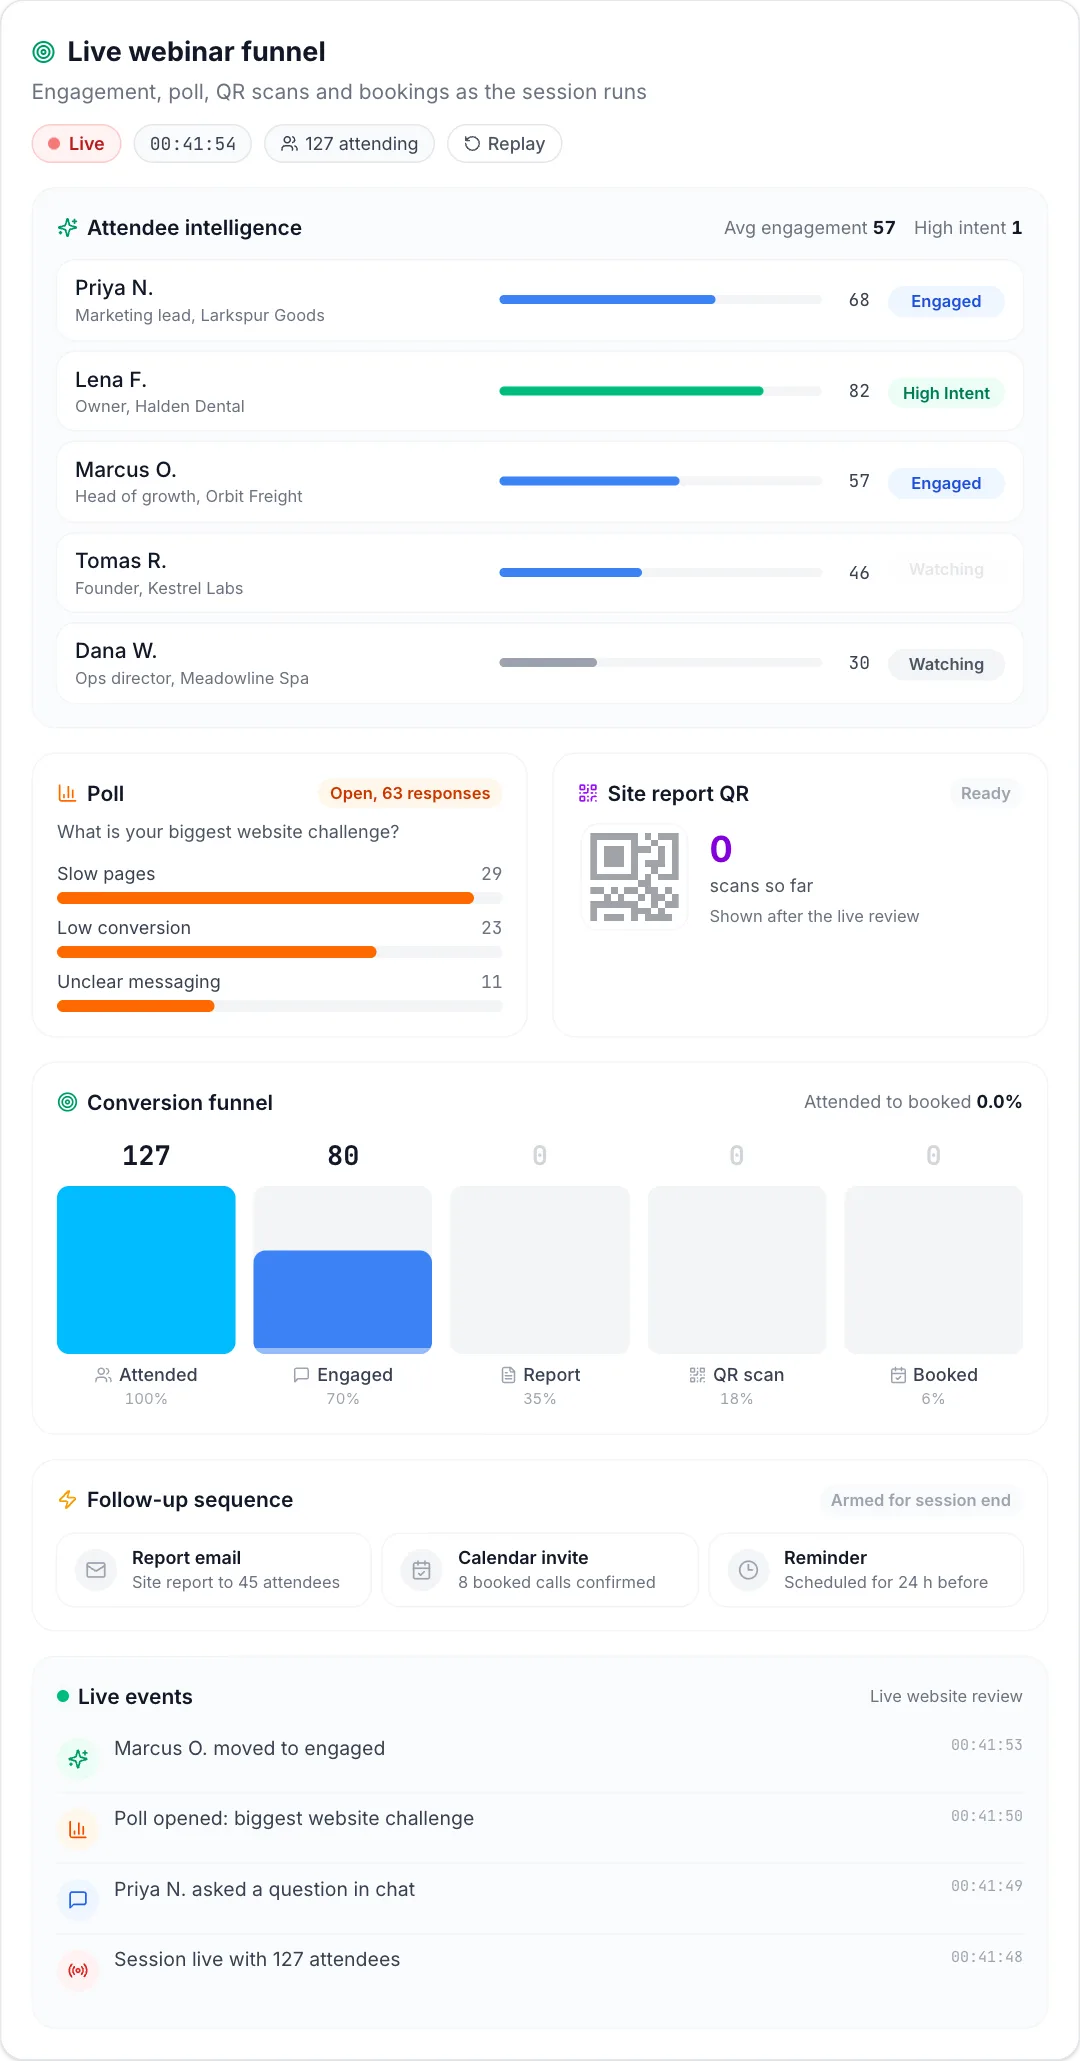
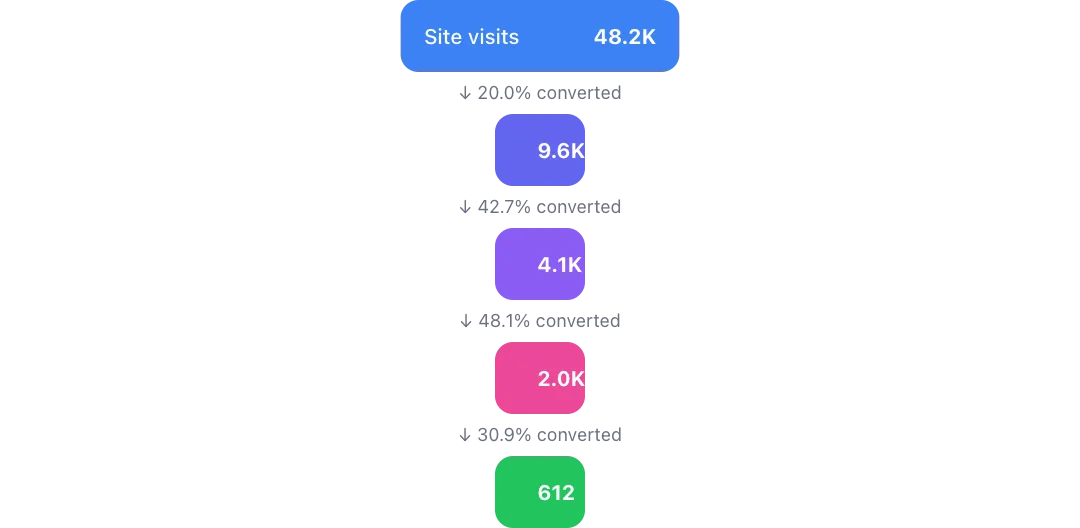
A live webinar's conversion funnel: attendee engagement scores rise as the session runs, a poll closes, QR scans tick in, bookings drop from attended to engaged to booked, and the follow-up sequence fires beside a live event feed.
 Play
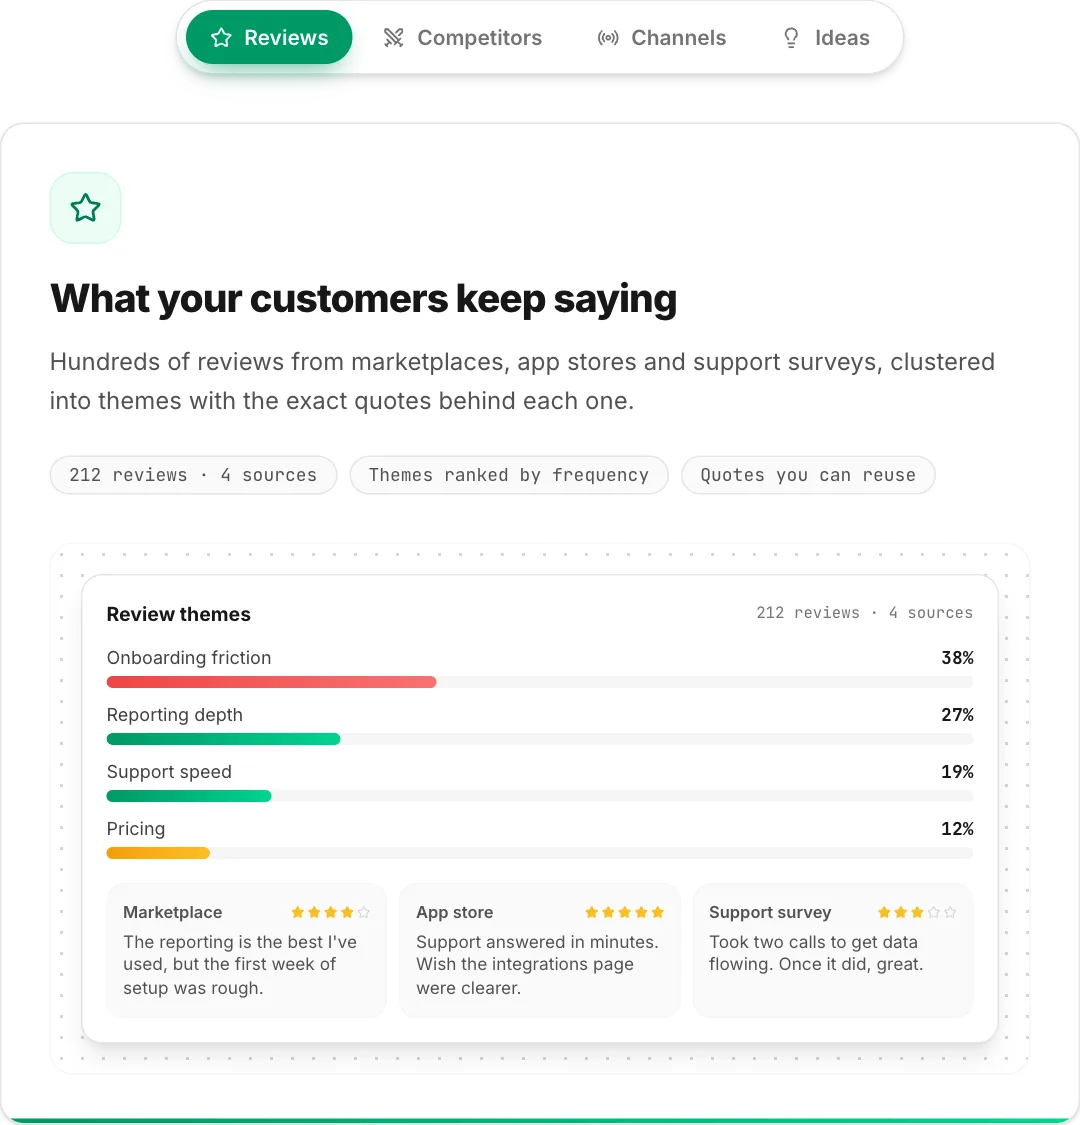
A tab strip with a sliding pill and four auto-advancing panels: review themes with quotes, a competitor score matrix with gaps flagged, a channel-fit ranking and an effort-versus-impact quadrant where ideas spring into place.
 Play
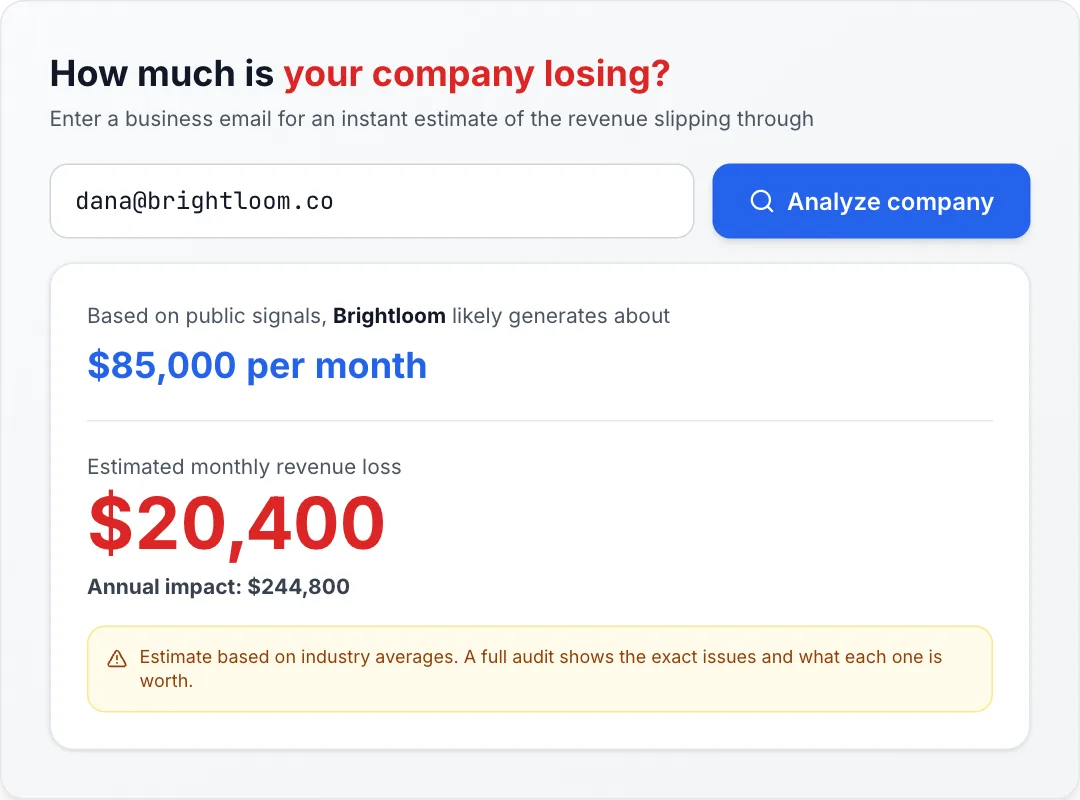
A business email types itself in, the analyze button fires, and the estimated revenue, monthly loss and annual impact count up in a result card.
 Play
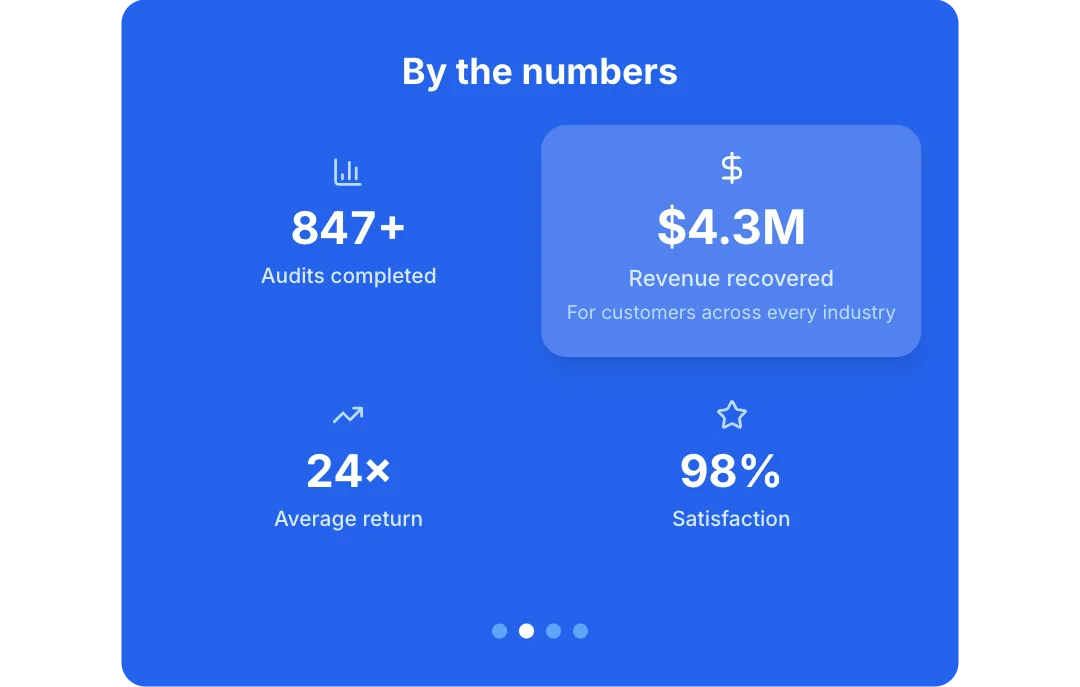
Headline numbers on a blue panel; the spotlight moves from stat to stat, each one scales up, counts up from zero and reveals the line beneath it.
 Play
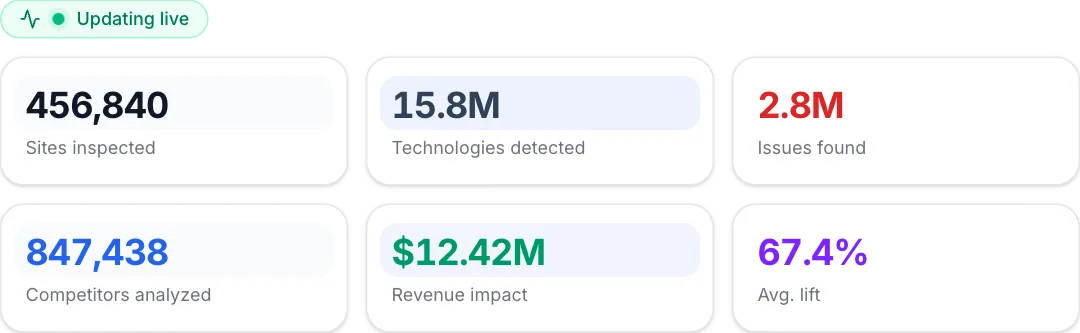
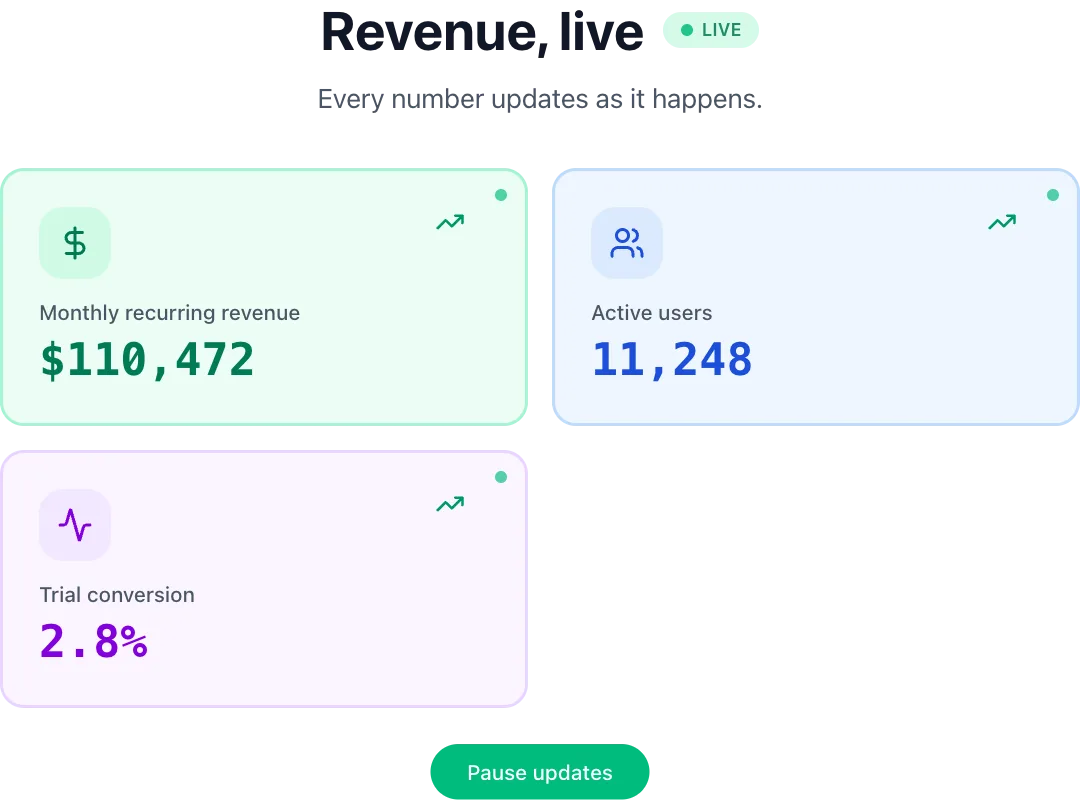
Six stat tiles count in on view, then keep ticking upward at their own pace with a soft flash on every update.
 Play
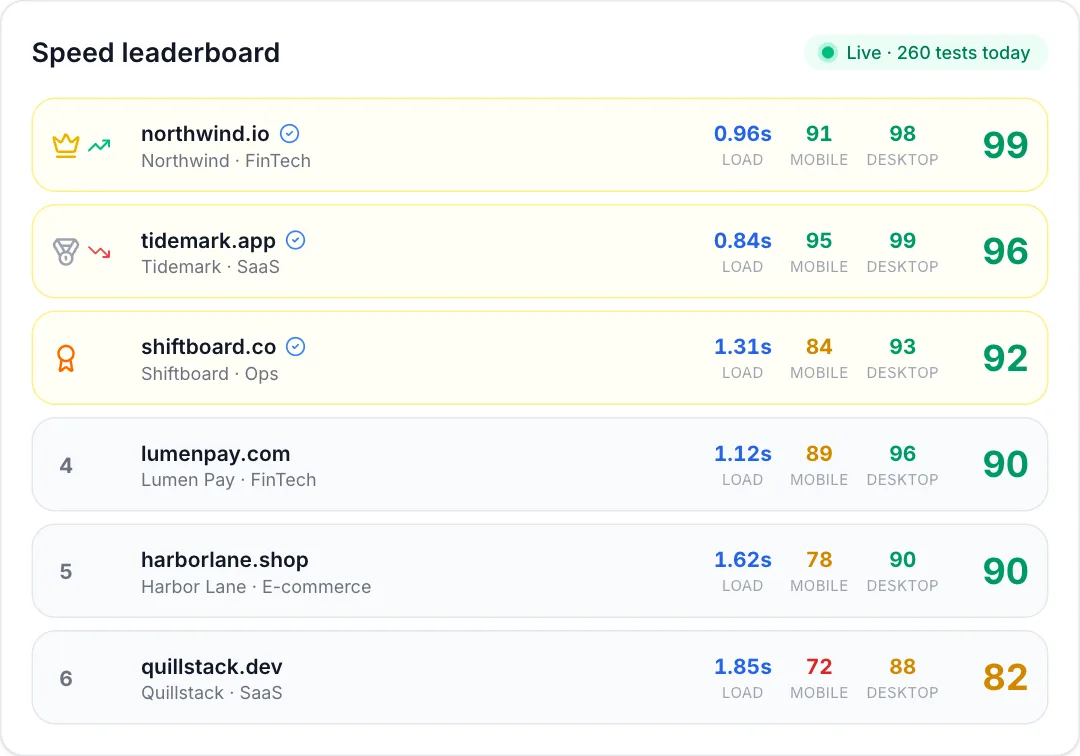
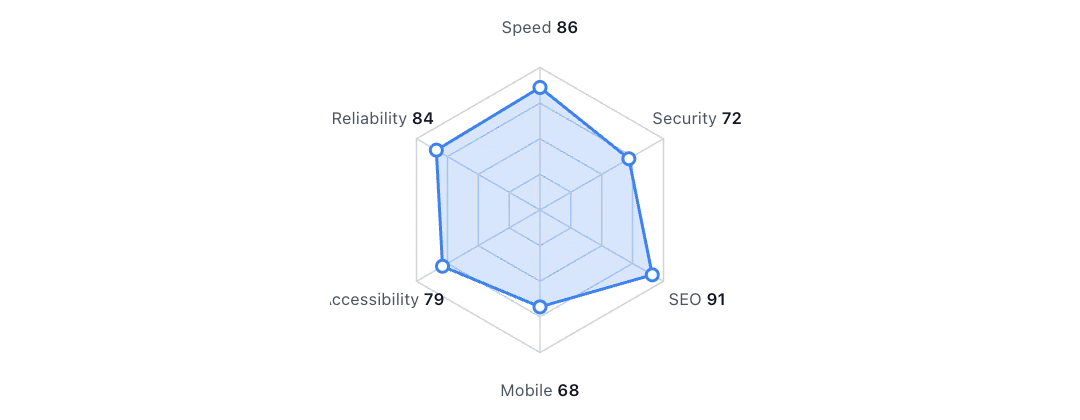
A live ranking of sites by performance score: scores drift, rows swap places, and rank-change arrows flash.
 Play
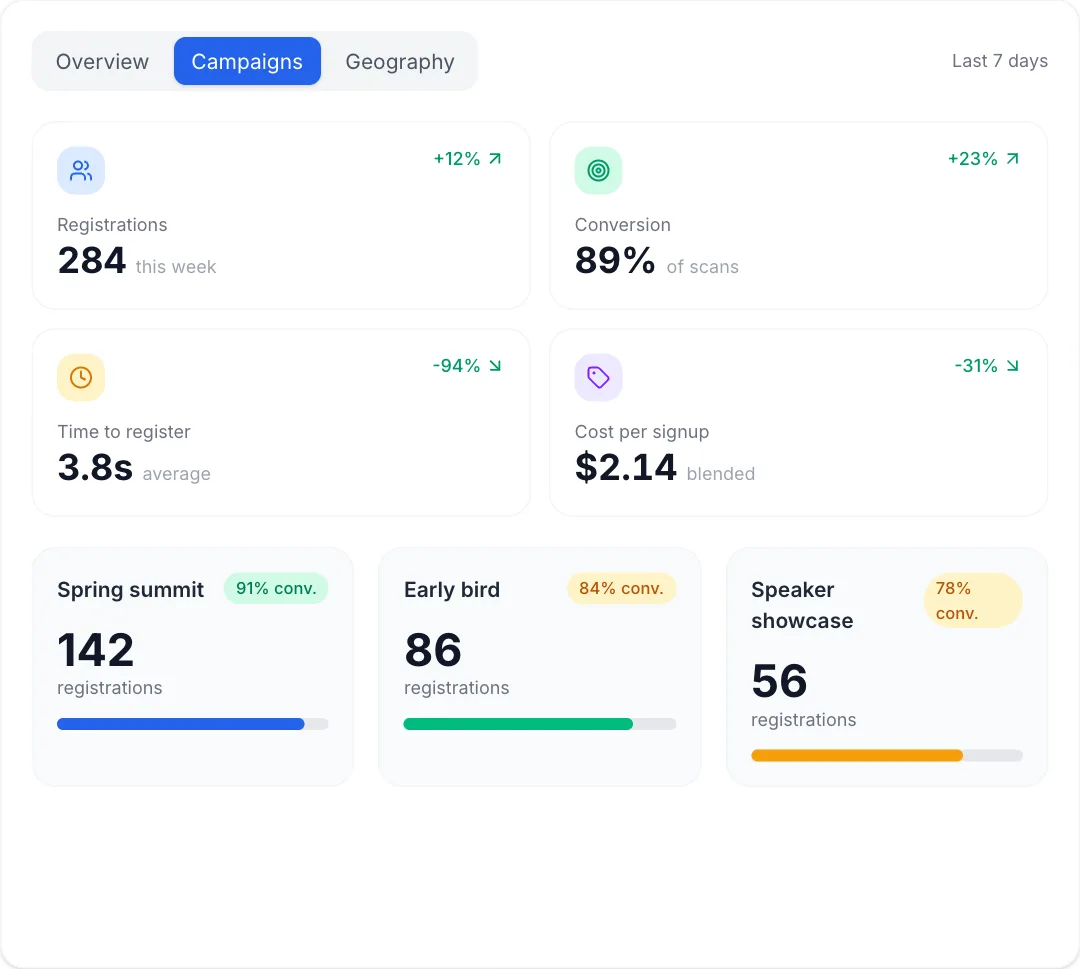
KPI cards count up, then the dashboard walks through its own tabs: a week of bars, the source split, campaign cards and a pulsing map.
 Play
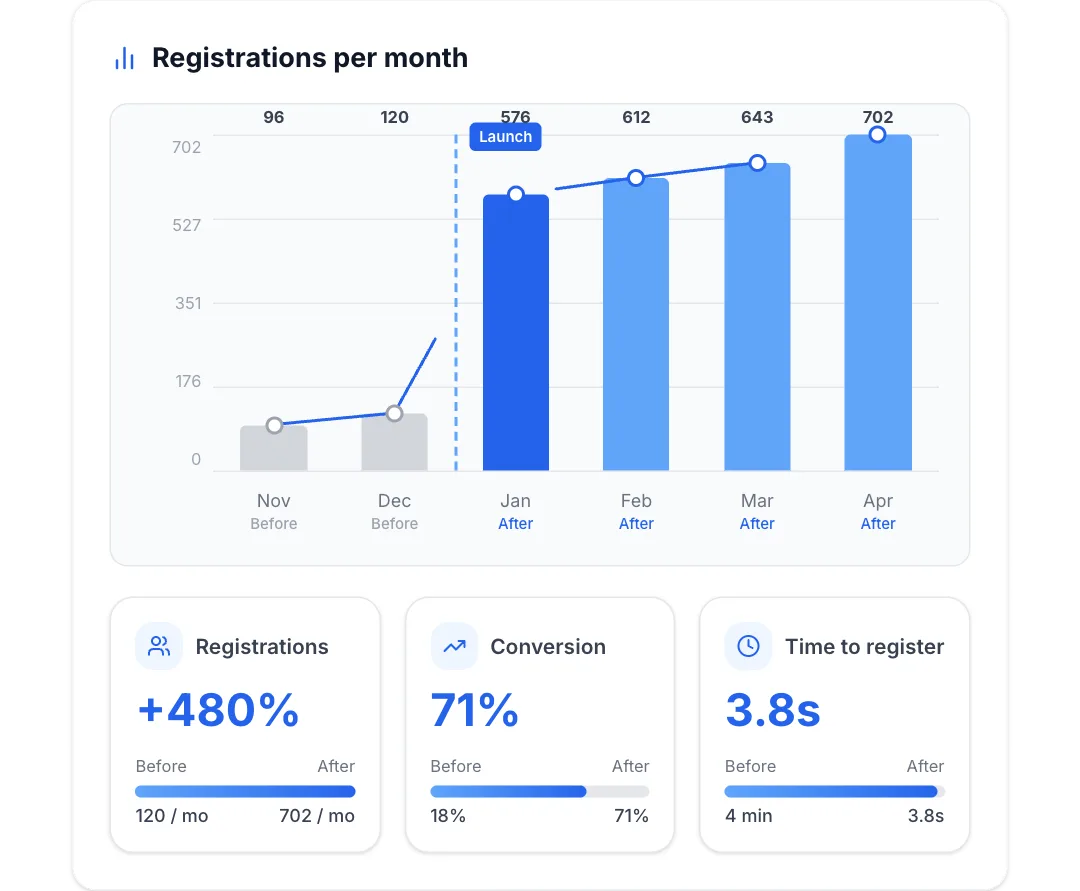
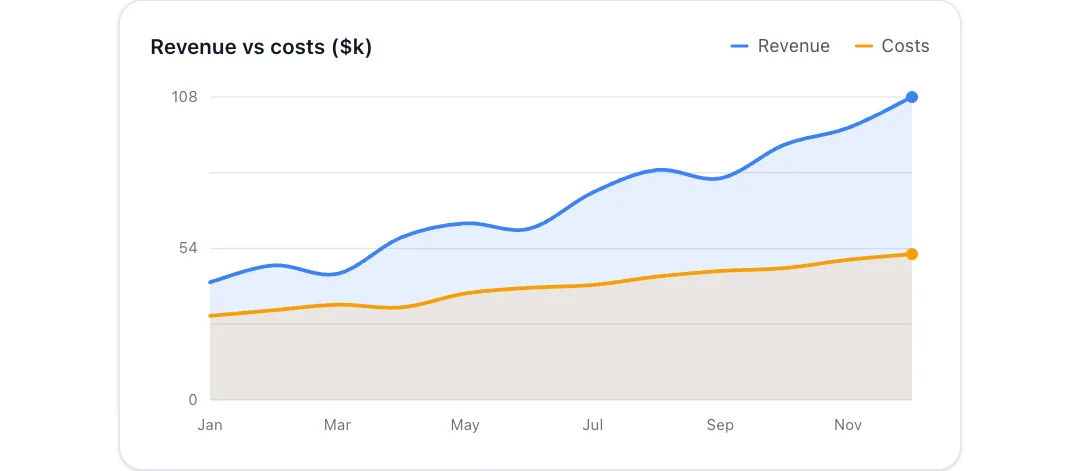
Monthly bars rise, a line draws through their tops, a dashed launch divider splits before from after, and three result cards fill in beneath.
 Play
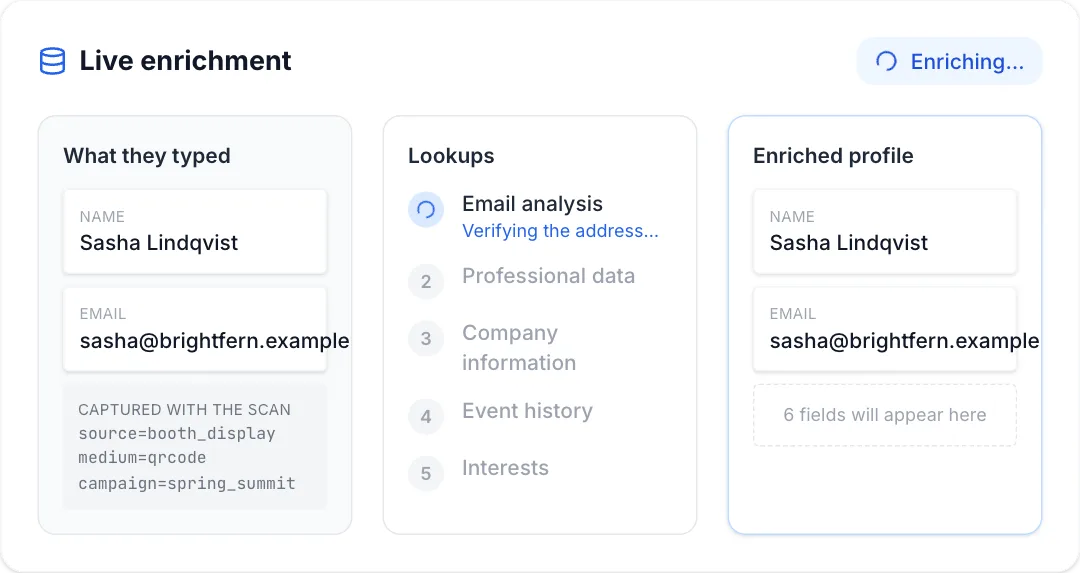
A bare signup on the left, a five-step lookup in the middle, and a profile on the right that fills in field by field as each step completes.
 Play
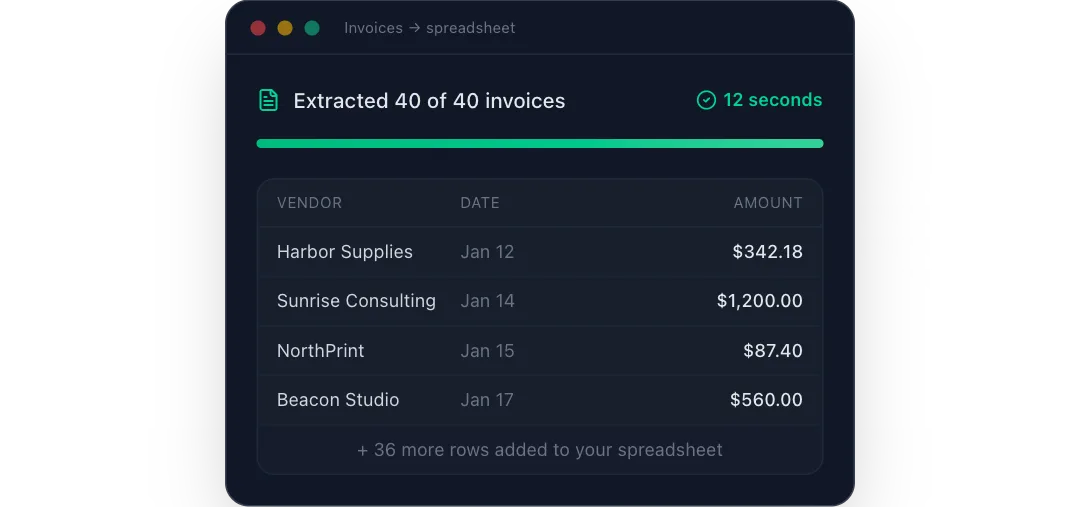
A stack of invoices is read one by one while clean spreadsheet rows fill in under a progress bar.
 Play
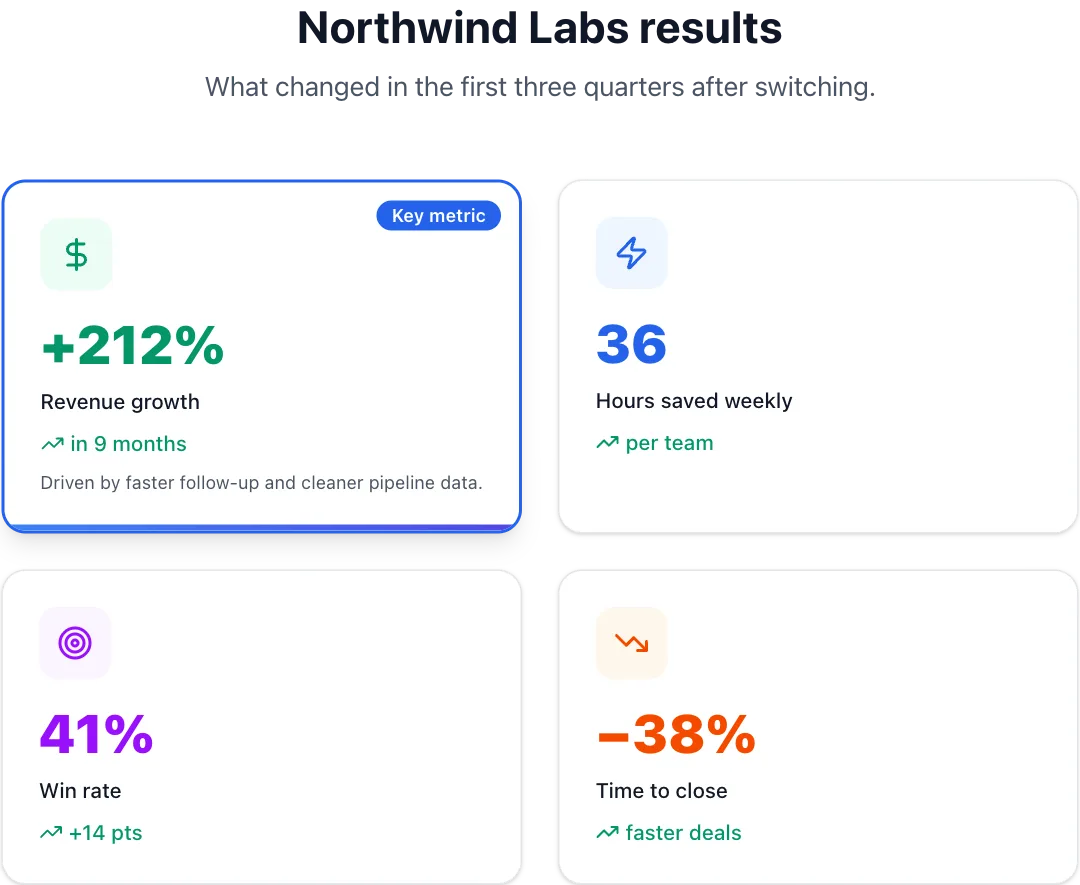
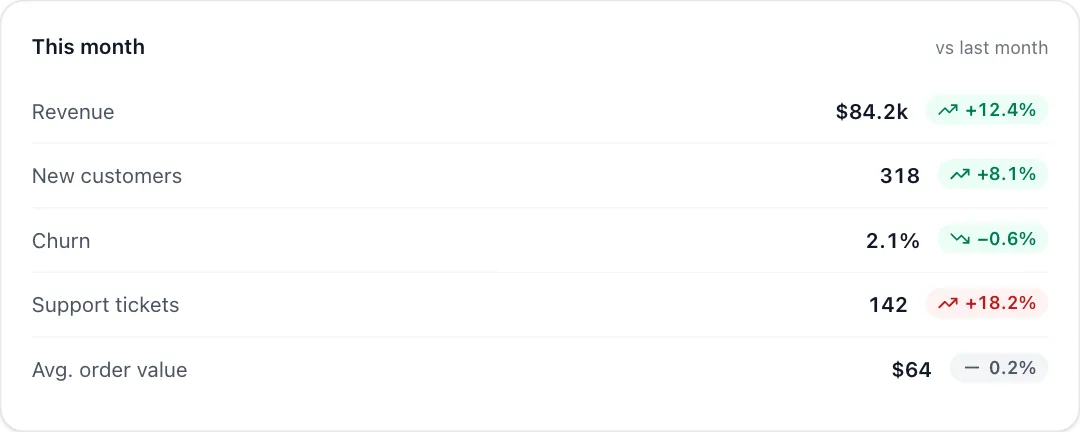
A customer's results as springy metric cards, a hero number or a compact row.
 Play
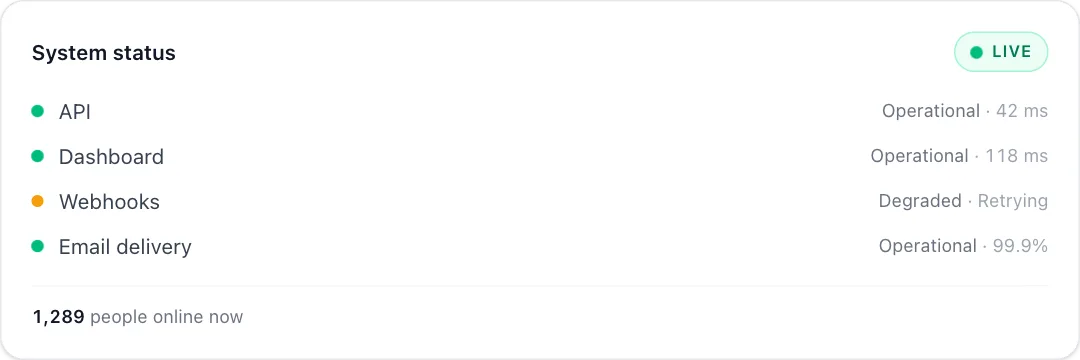
A status card with a pulsing live badge, service dots and a ticking viewer count.
 Play
 Play
 Play
 Play
 Play
 Play
 Play
 Play
 Play
 Play
 Play
 Play
 Play
 Play