
Bar chart
Bars that grow in one after another, with values and labels.
Animated React components for your site. Download the source, or have Programmable make one like it about your product.
Bars that grow in one after another, with values and labels.

A donut that draws its segments in turn, with a centre total and legend.

Concentric rings that fill to each goal.
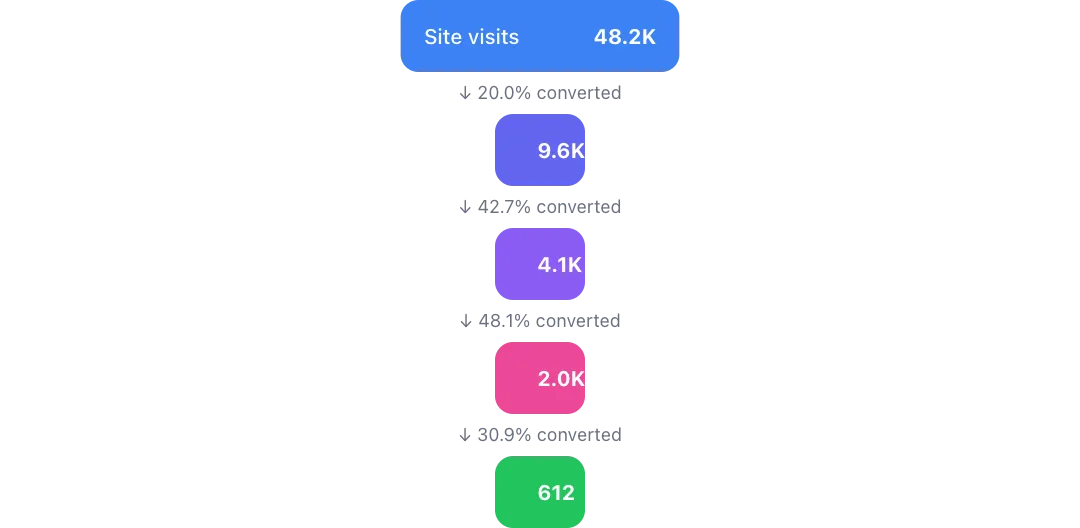
A conversion funnel whose stages narrow in, with drop-off between them.

A score that counts up as its ring fills, coloured by grade.
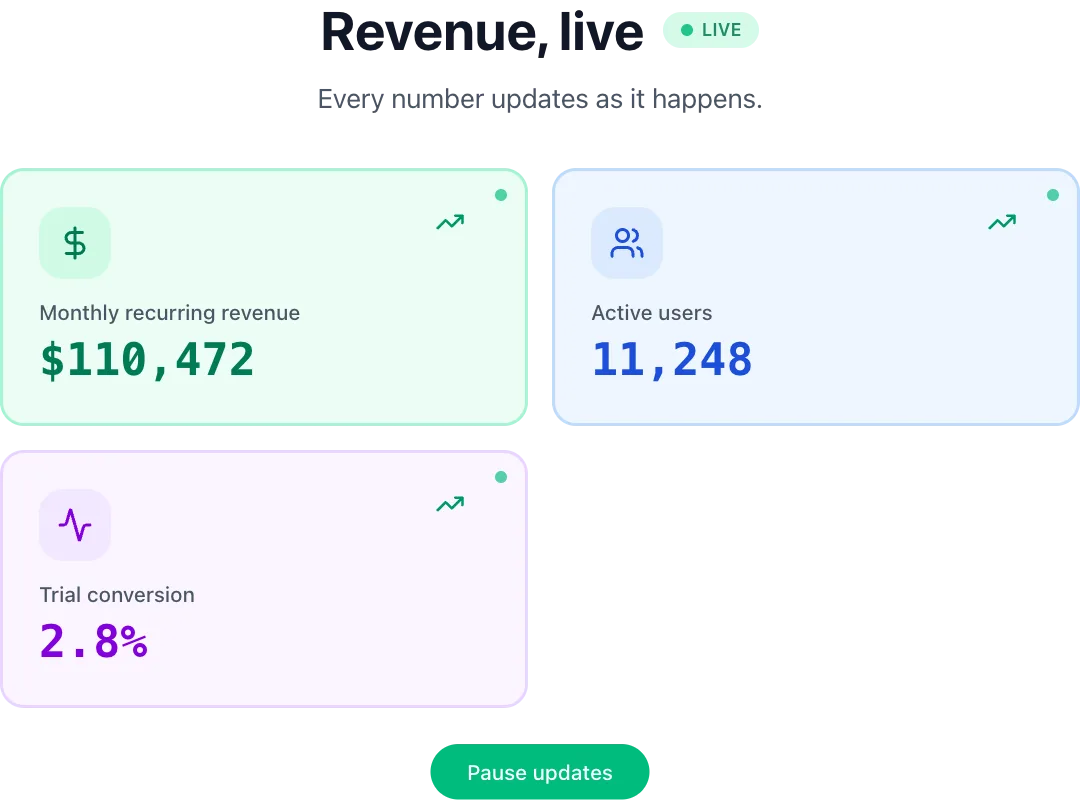
Metric cards whose numbers tick up live, with trends.
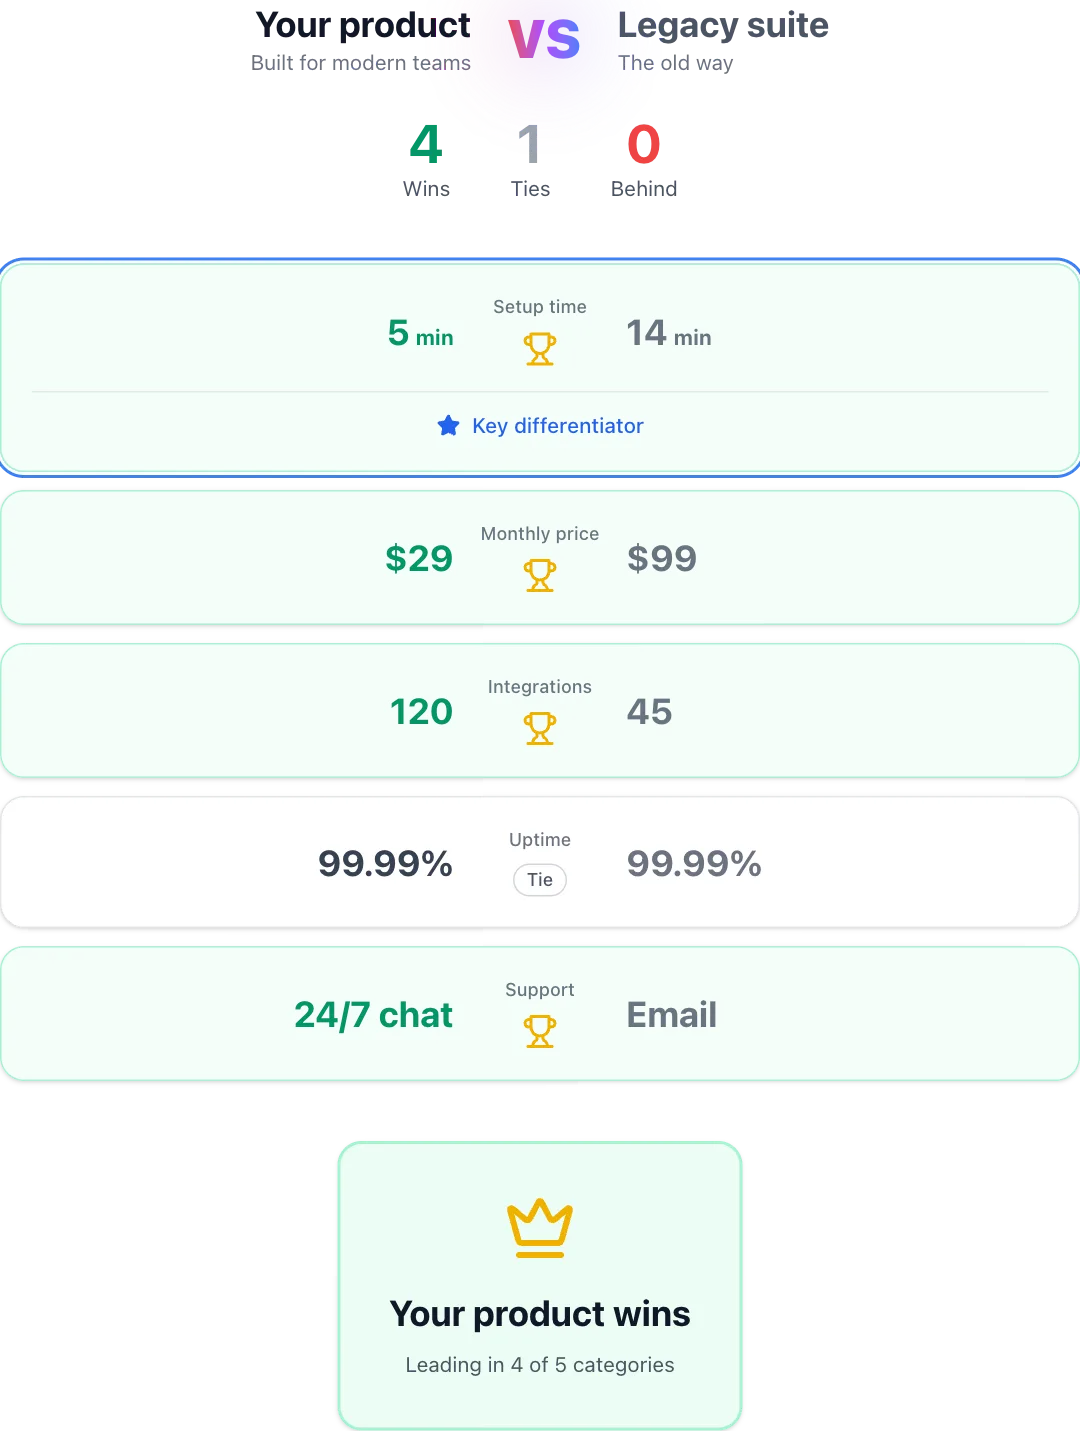
You against them, feature by feature, with a winner.
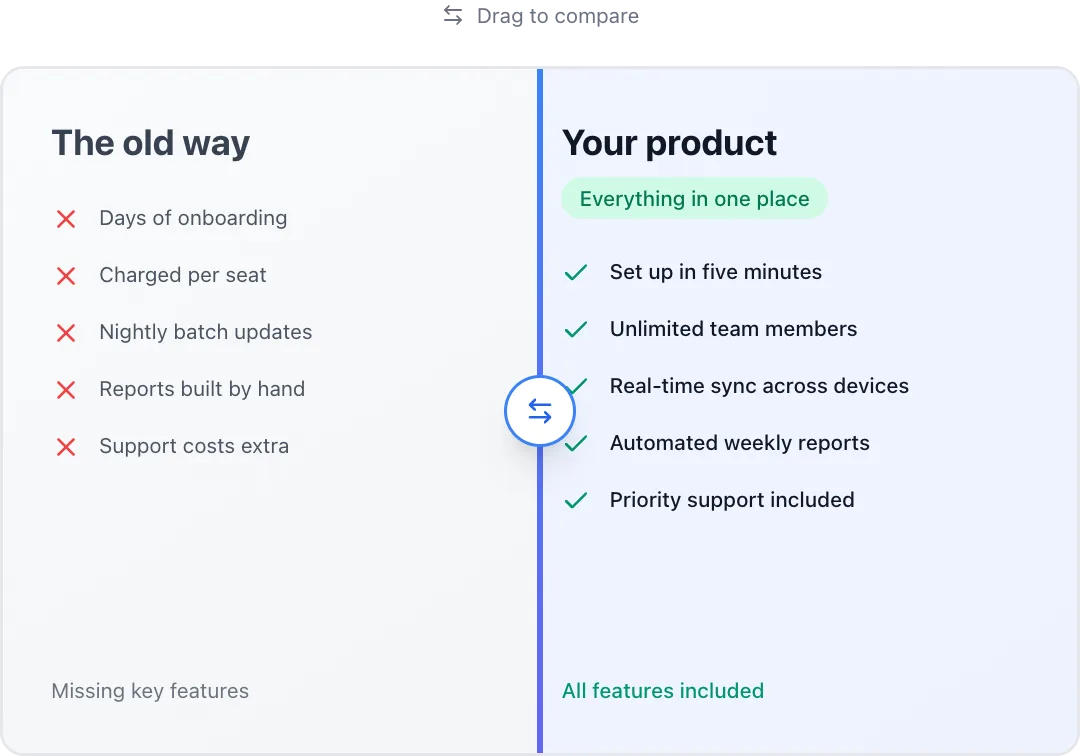
Drag a divider to compare the old way with yours.
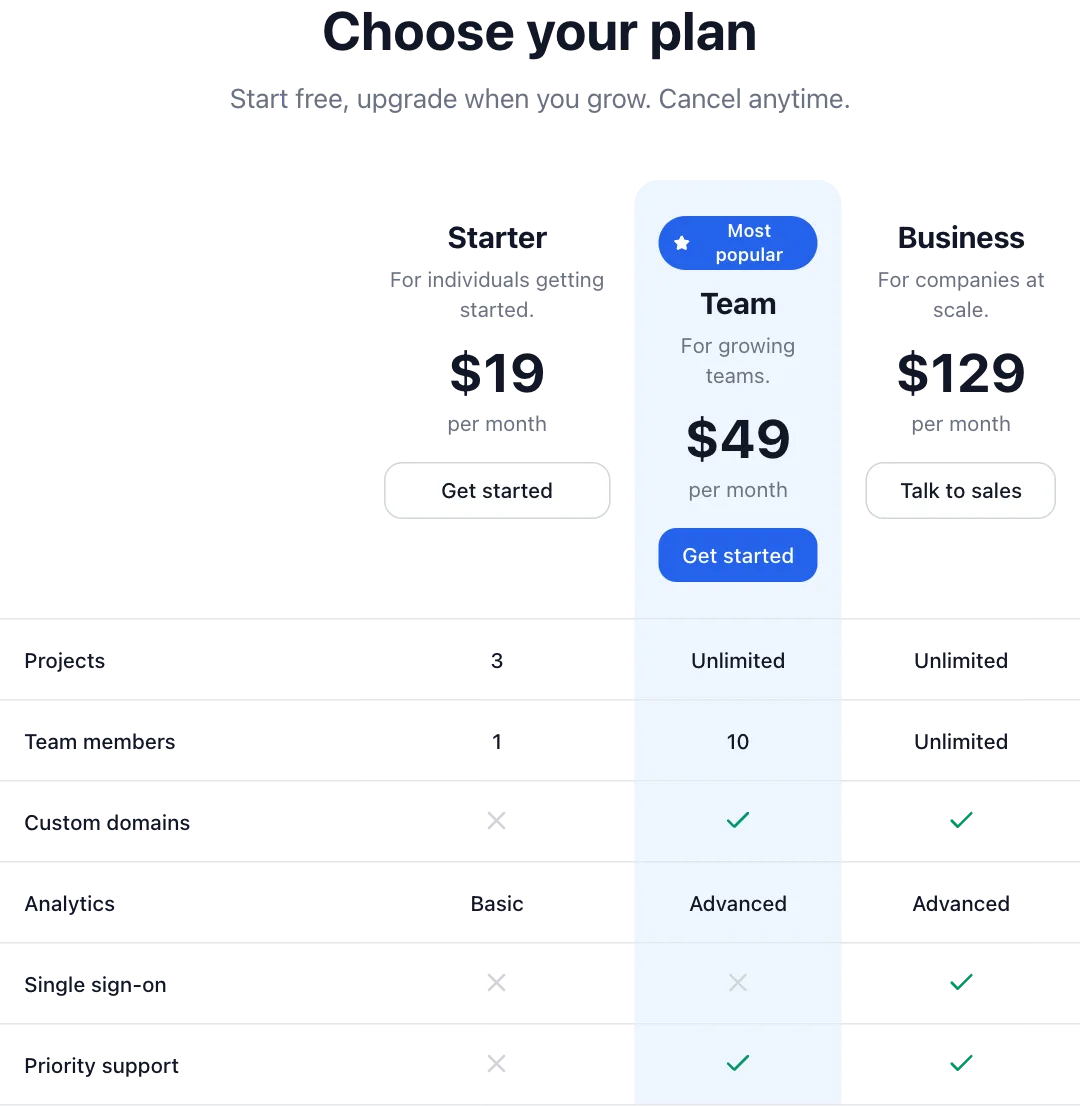
Plans that rise into place, with a highlighted favourite.
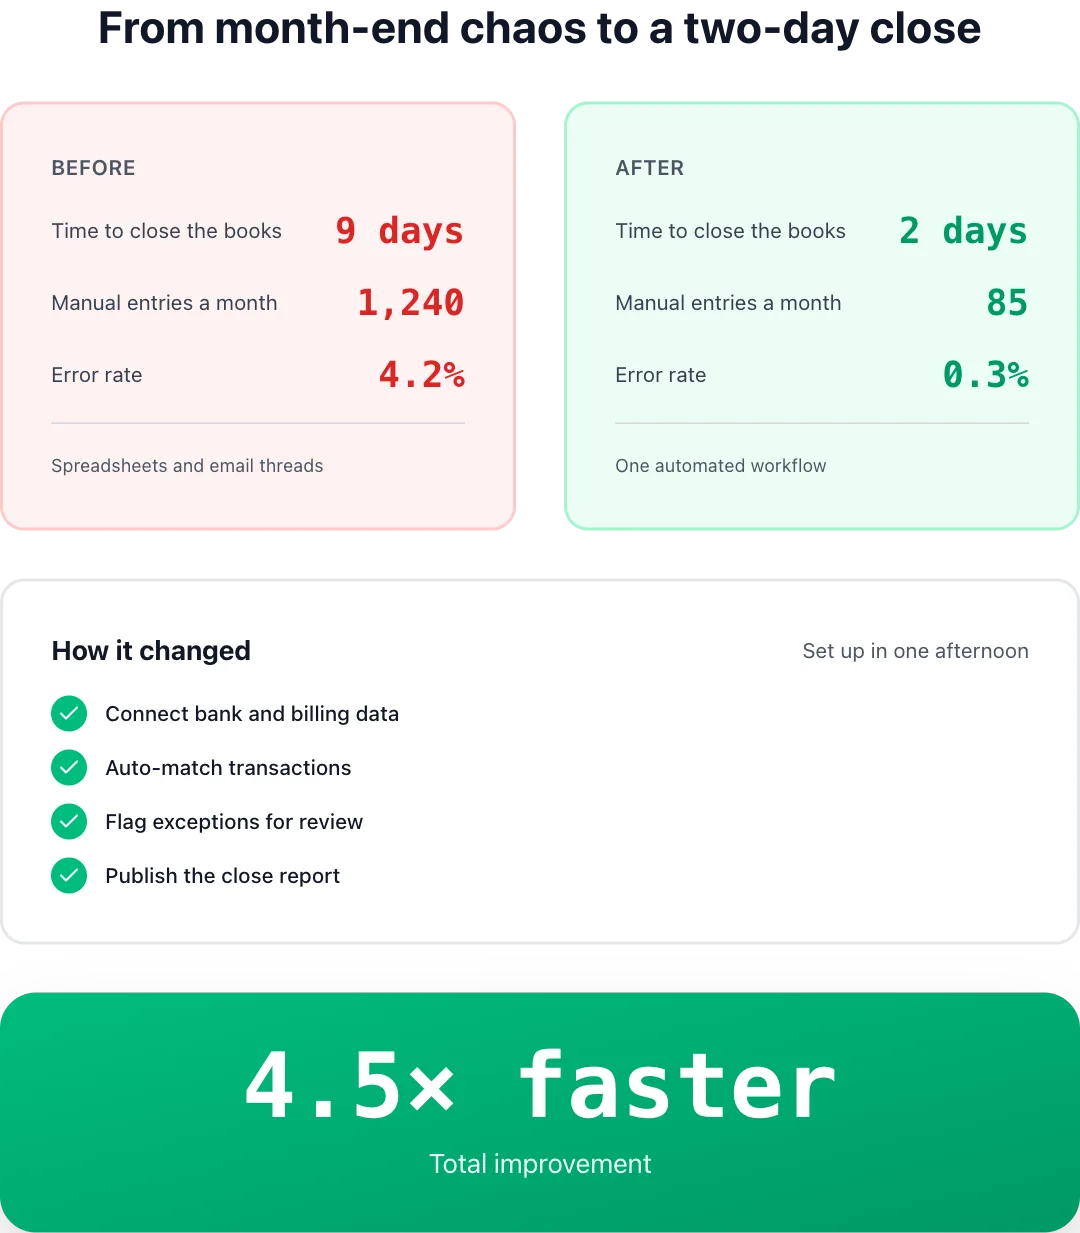
The before state, the steps, then the after metrics.
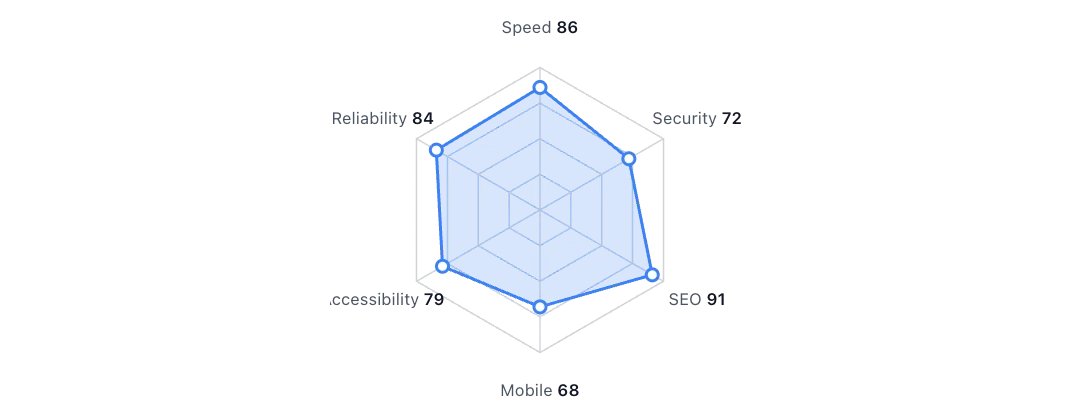
A spider chart whose shape grows out from the centre before each point pops in.
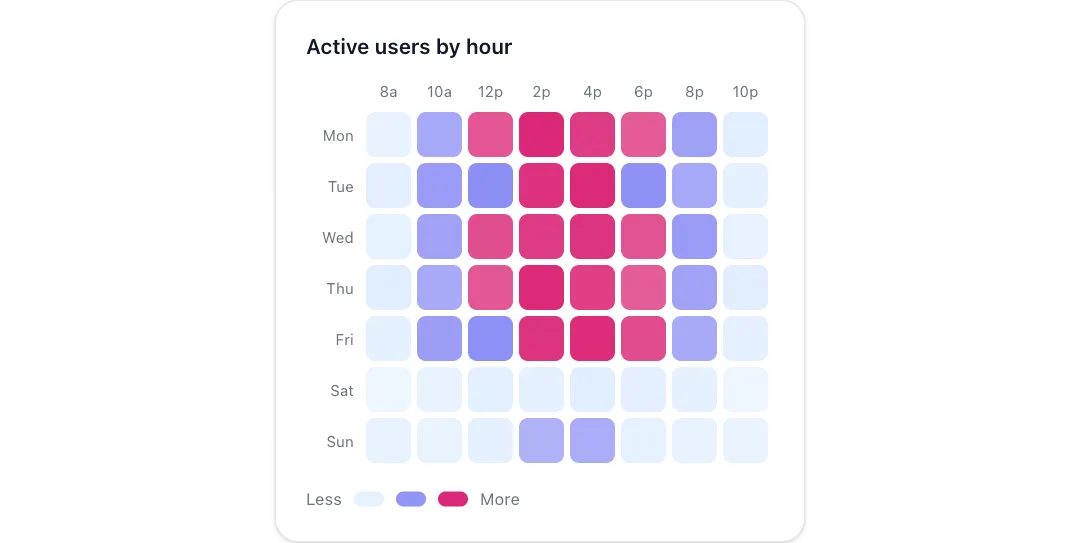
An activity grid whose cells fade in cell by cell, shaded from quiet to busy.
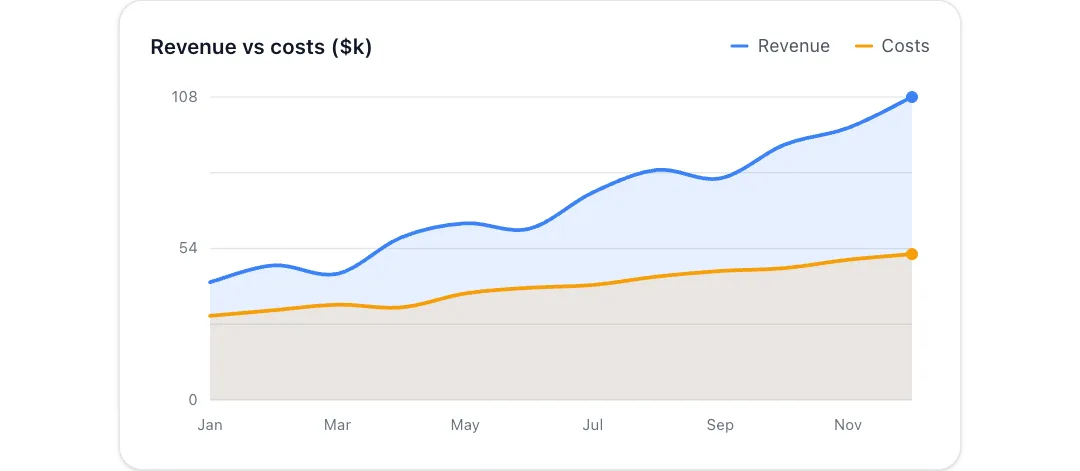
Lines that draw themselves left to right over a soft area fill, with a legend.

A metric card whose number counts up while its sparkline draws beside the trend.

A compact trend line that draws itself, with a soft fill and a pulsing latest point.
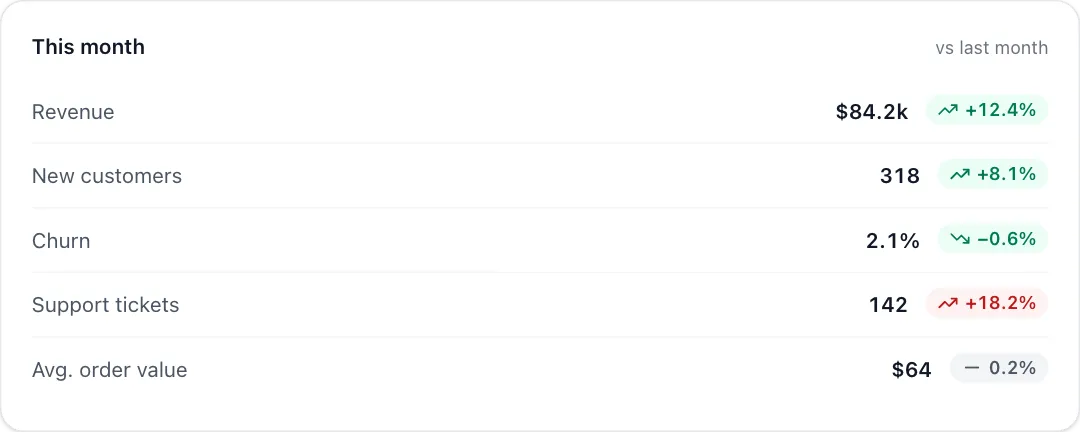
Metric rows whose up and down trend pills slide in one after another.

Big gradient numbers that count up when they scroll into view.
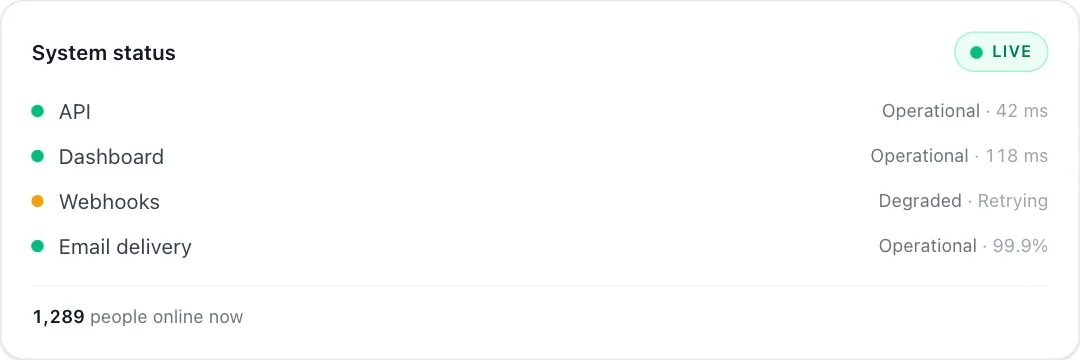
A status card with a pulsing live badge, service dots and a ticking viewer count.

A launch or offer countdown whose digits flip as each second passes.
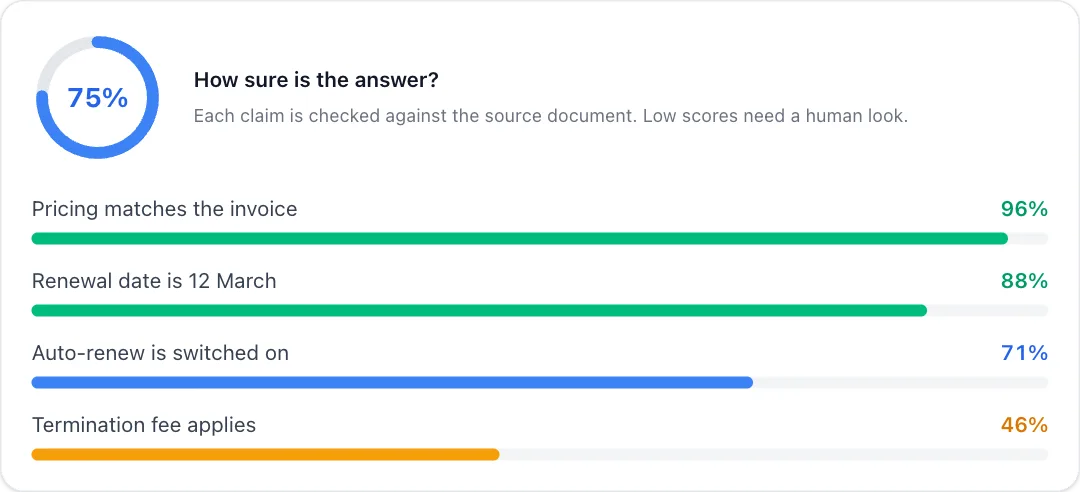
An AI answer's confidence ring with per-claim bars that fill in, coloured low to high.
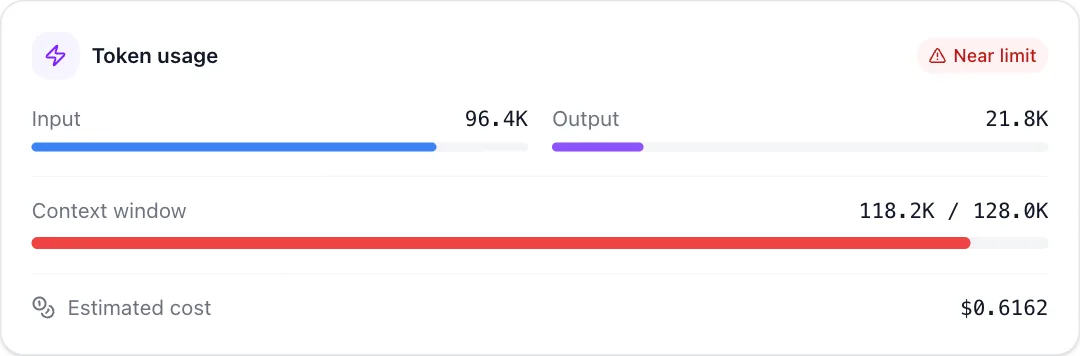
AI token usage that climbs as a response streams, filling the context window and warning near the limit.

An AI working indicator that steps through thinking, searching, analysing and writing.
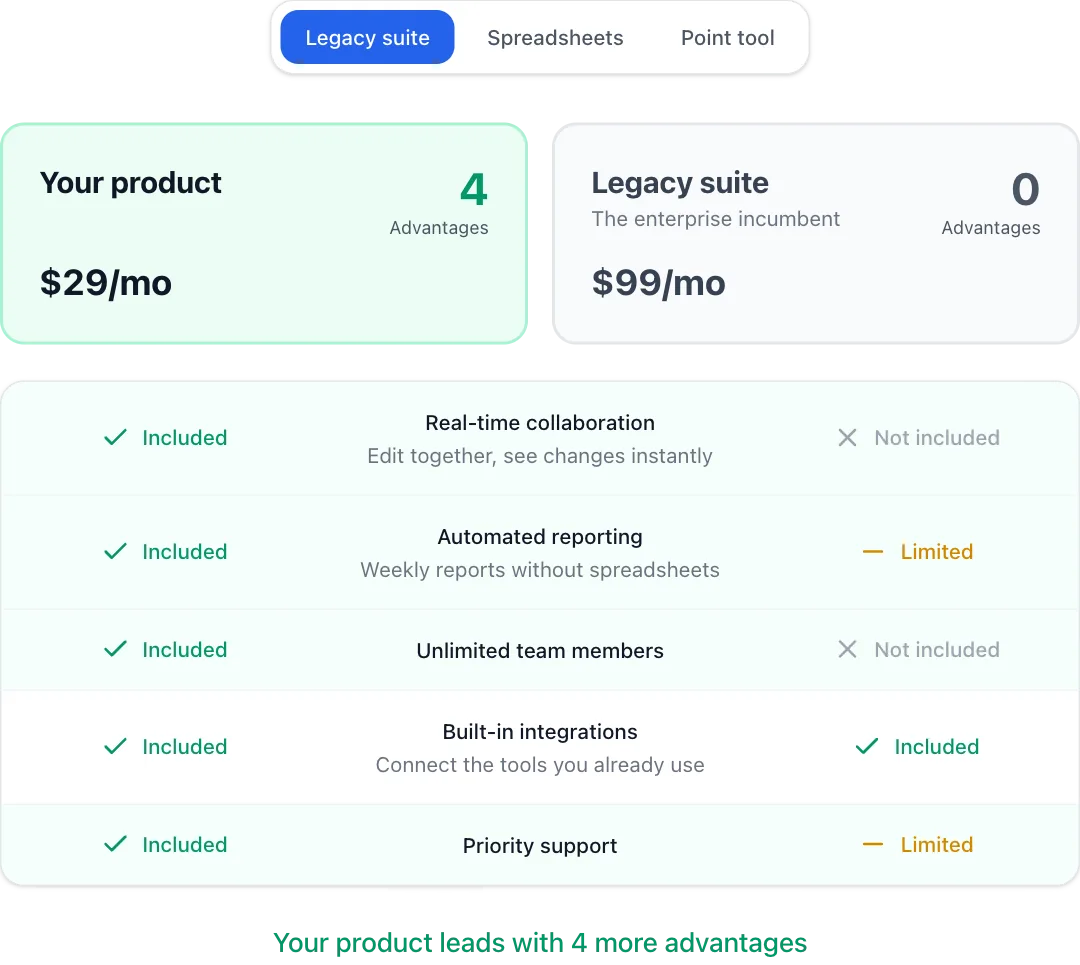
Switch between competitors with a sliding tab and see each feature marked yes, no or partial.
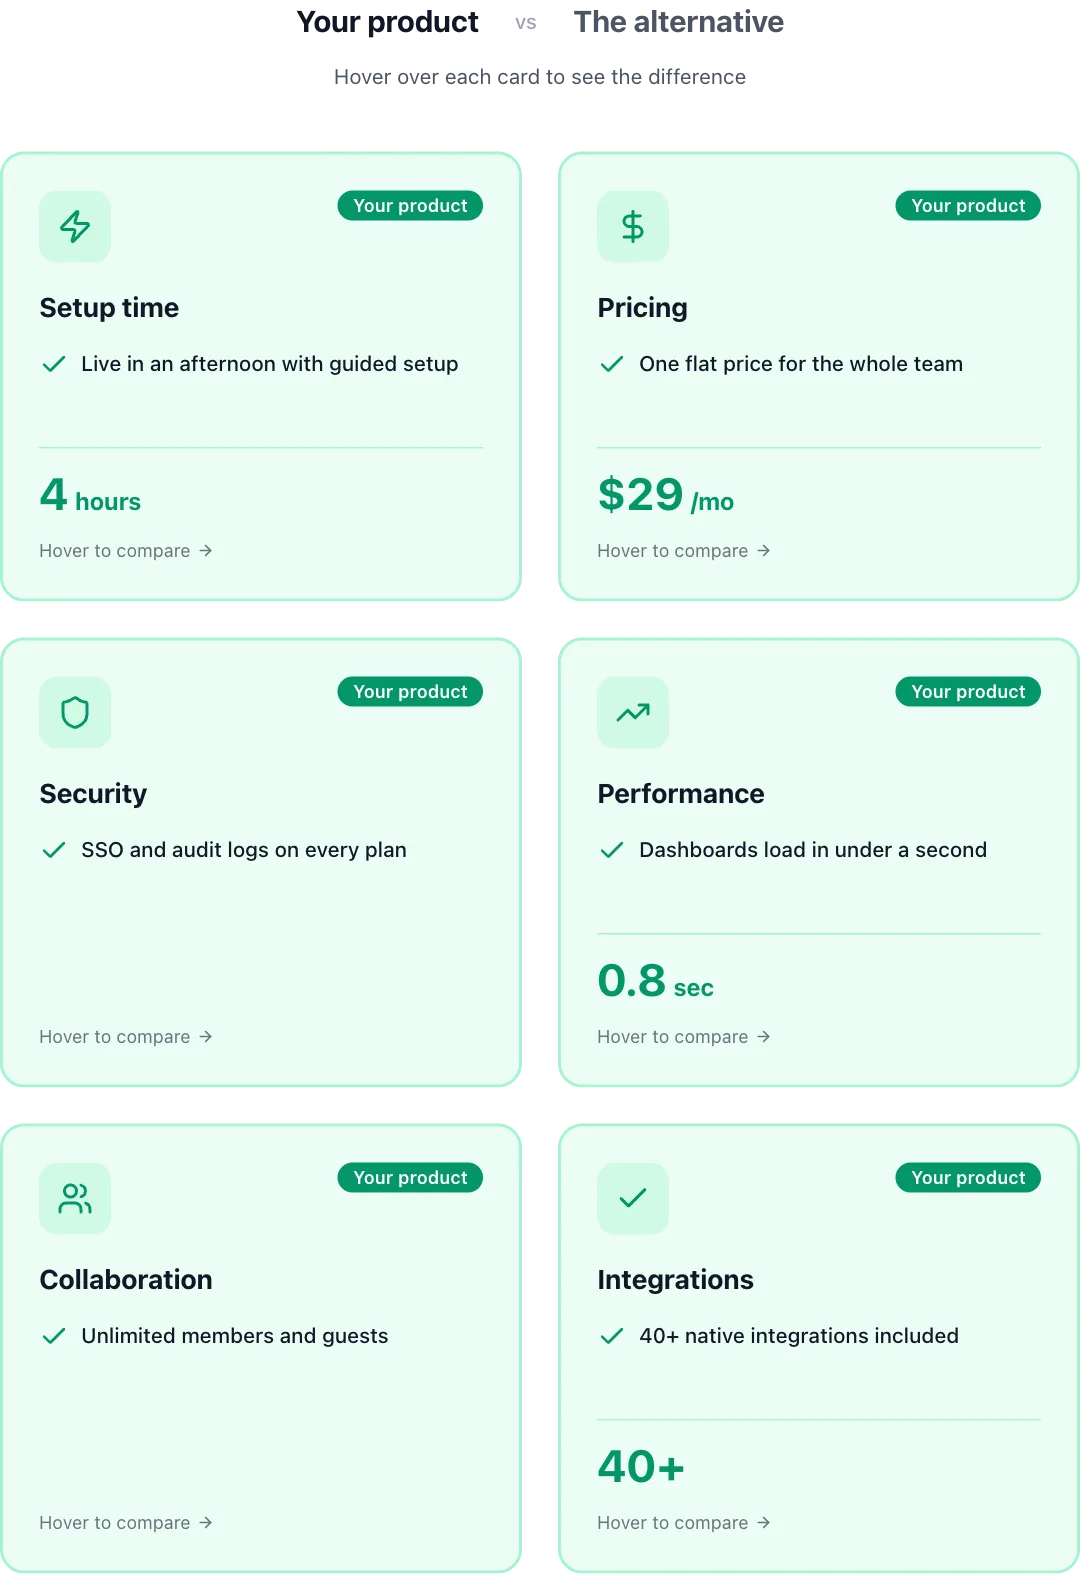
Cards that flip on hover from your advantage to the competitor's limitation.
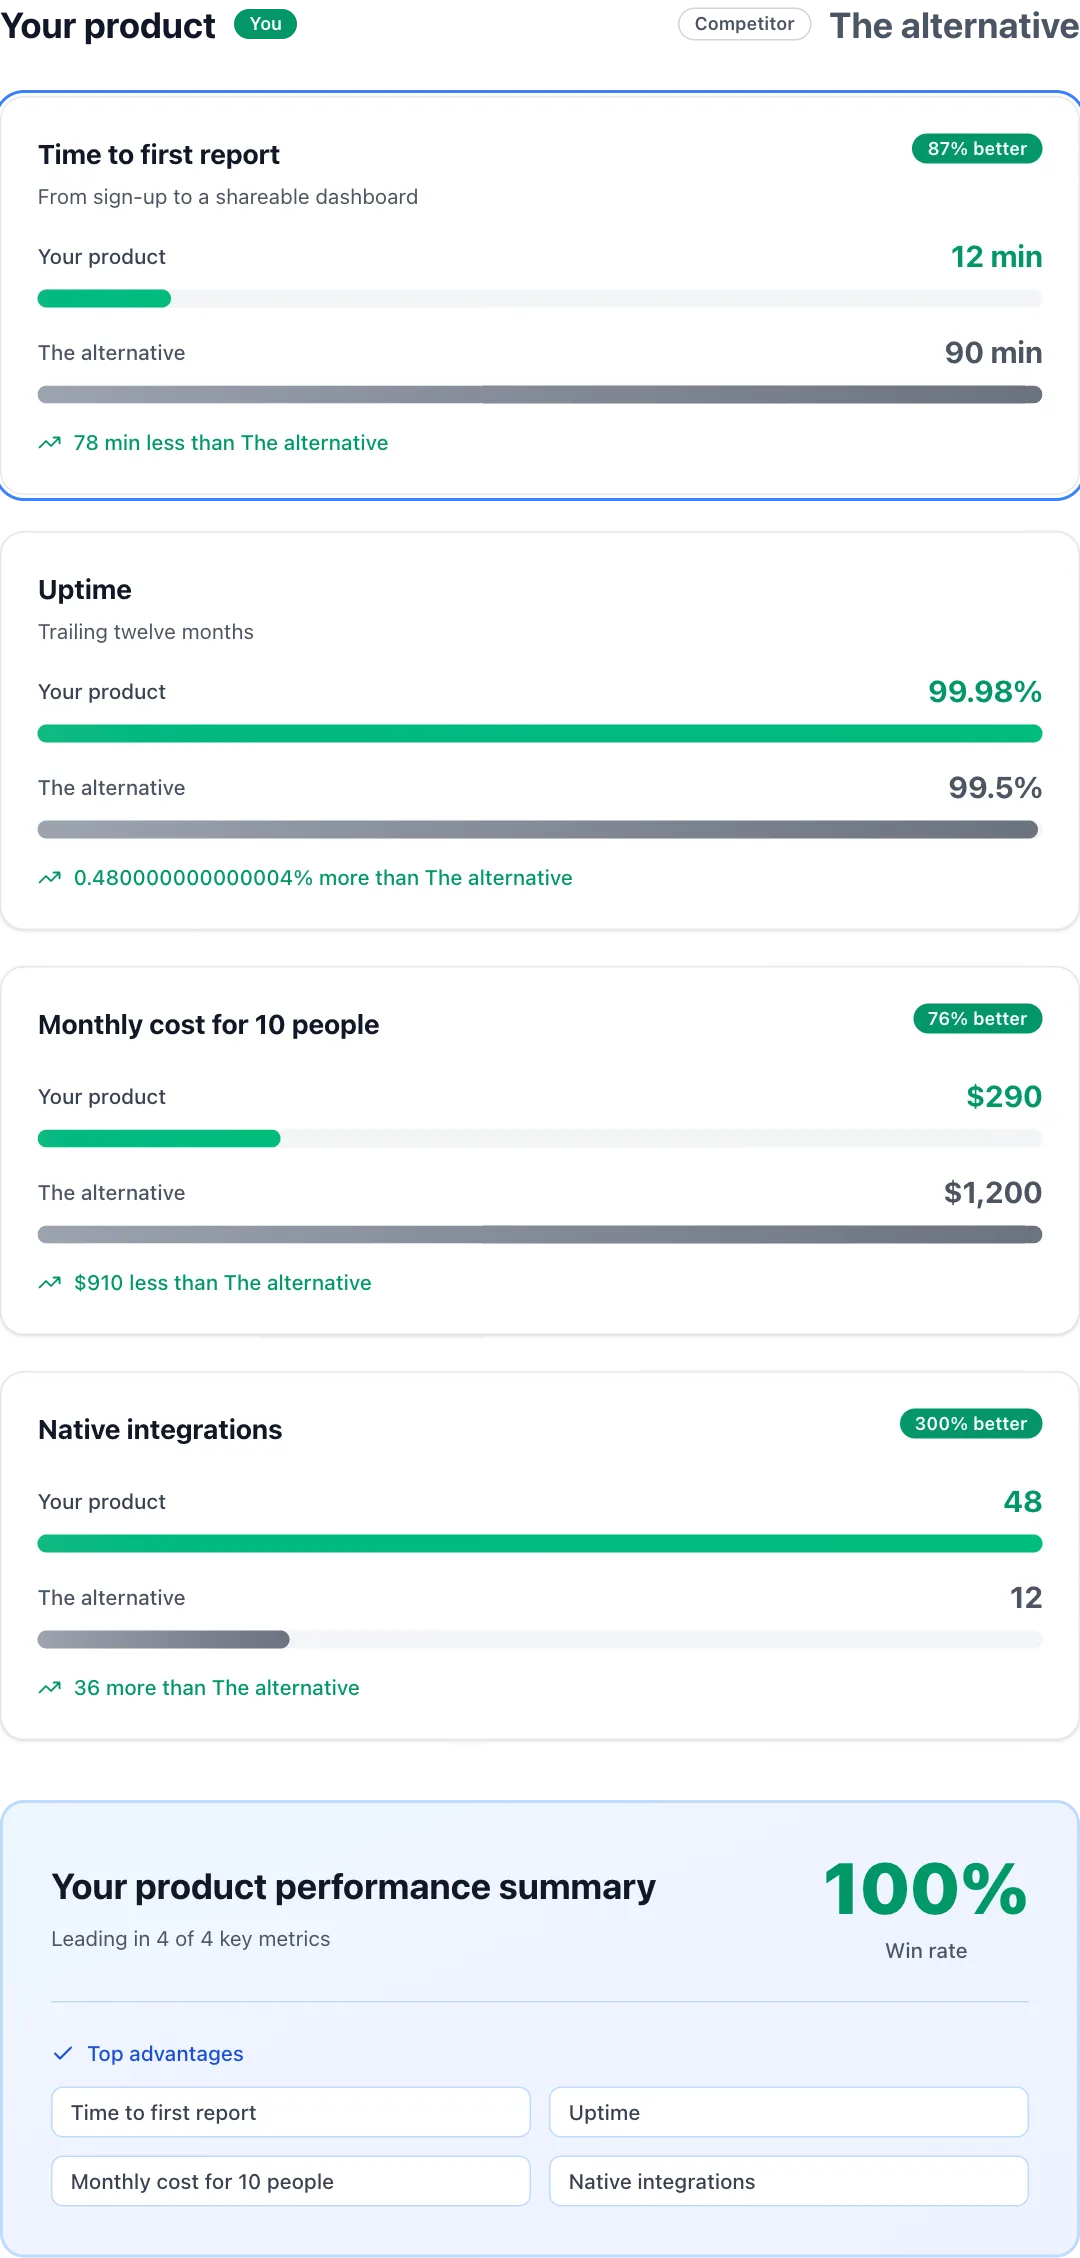
Head-to-head metric bars that grow into view, ending in a win-rate summary.
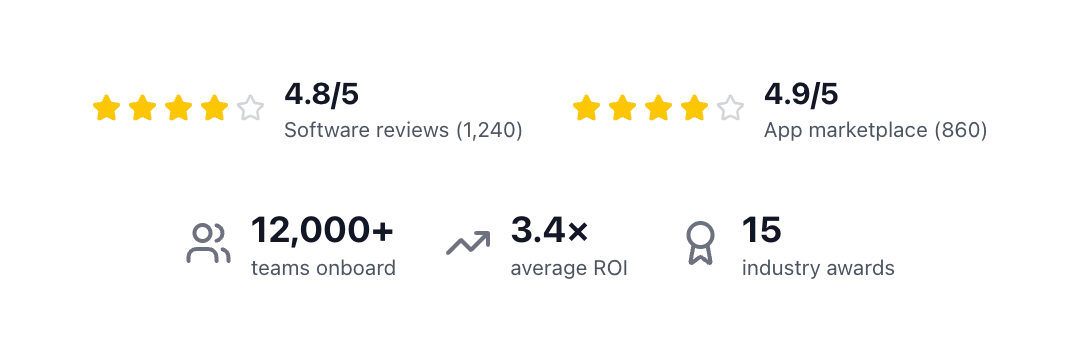
Star ratings and headline metrics that fade in, in default, compact or highlighted layouts.
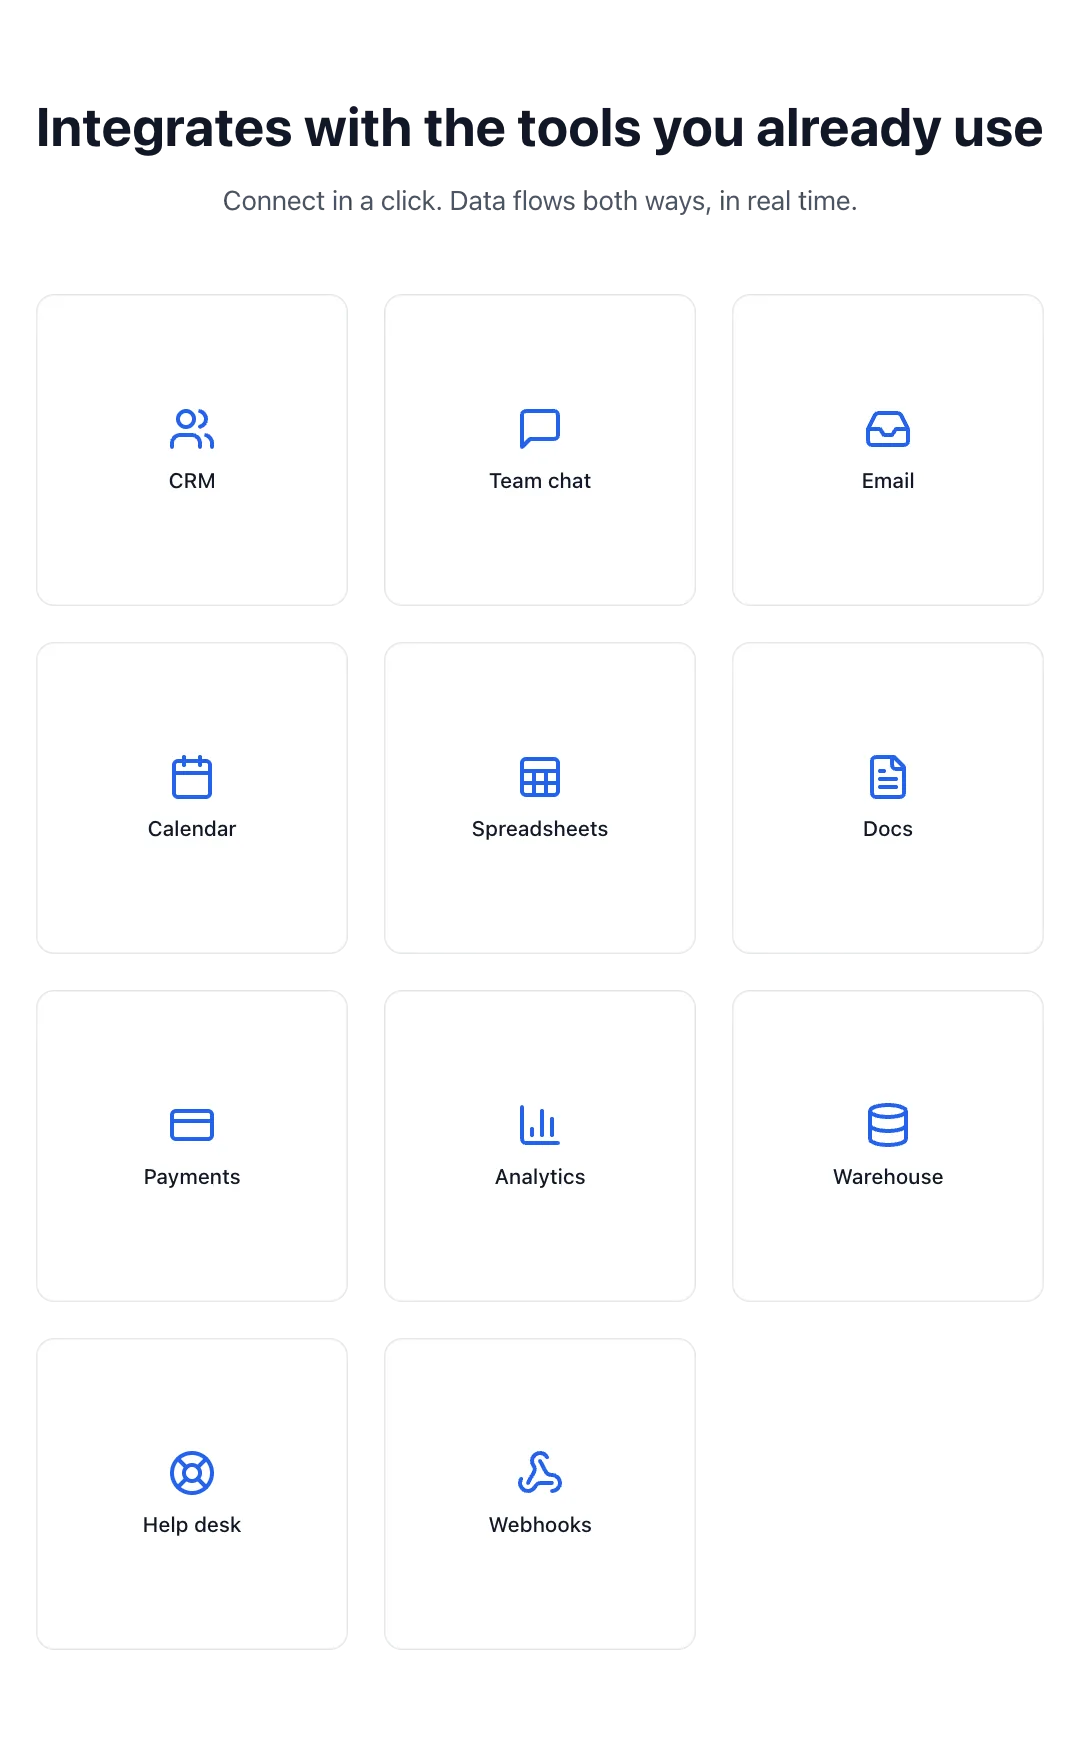
The tools you connect to as a staggered grid, grouped by category, or a minimal row.
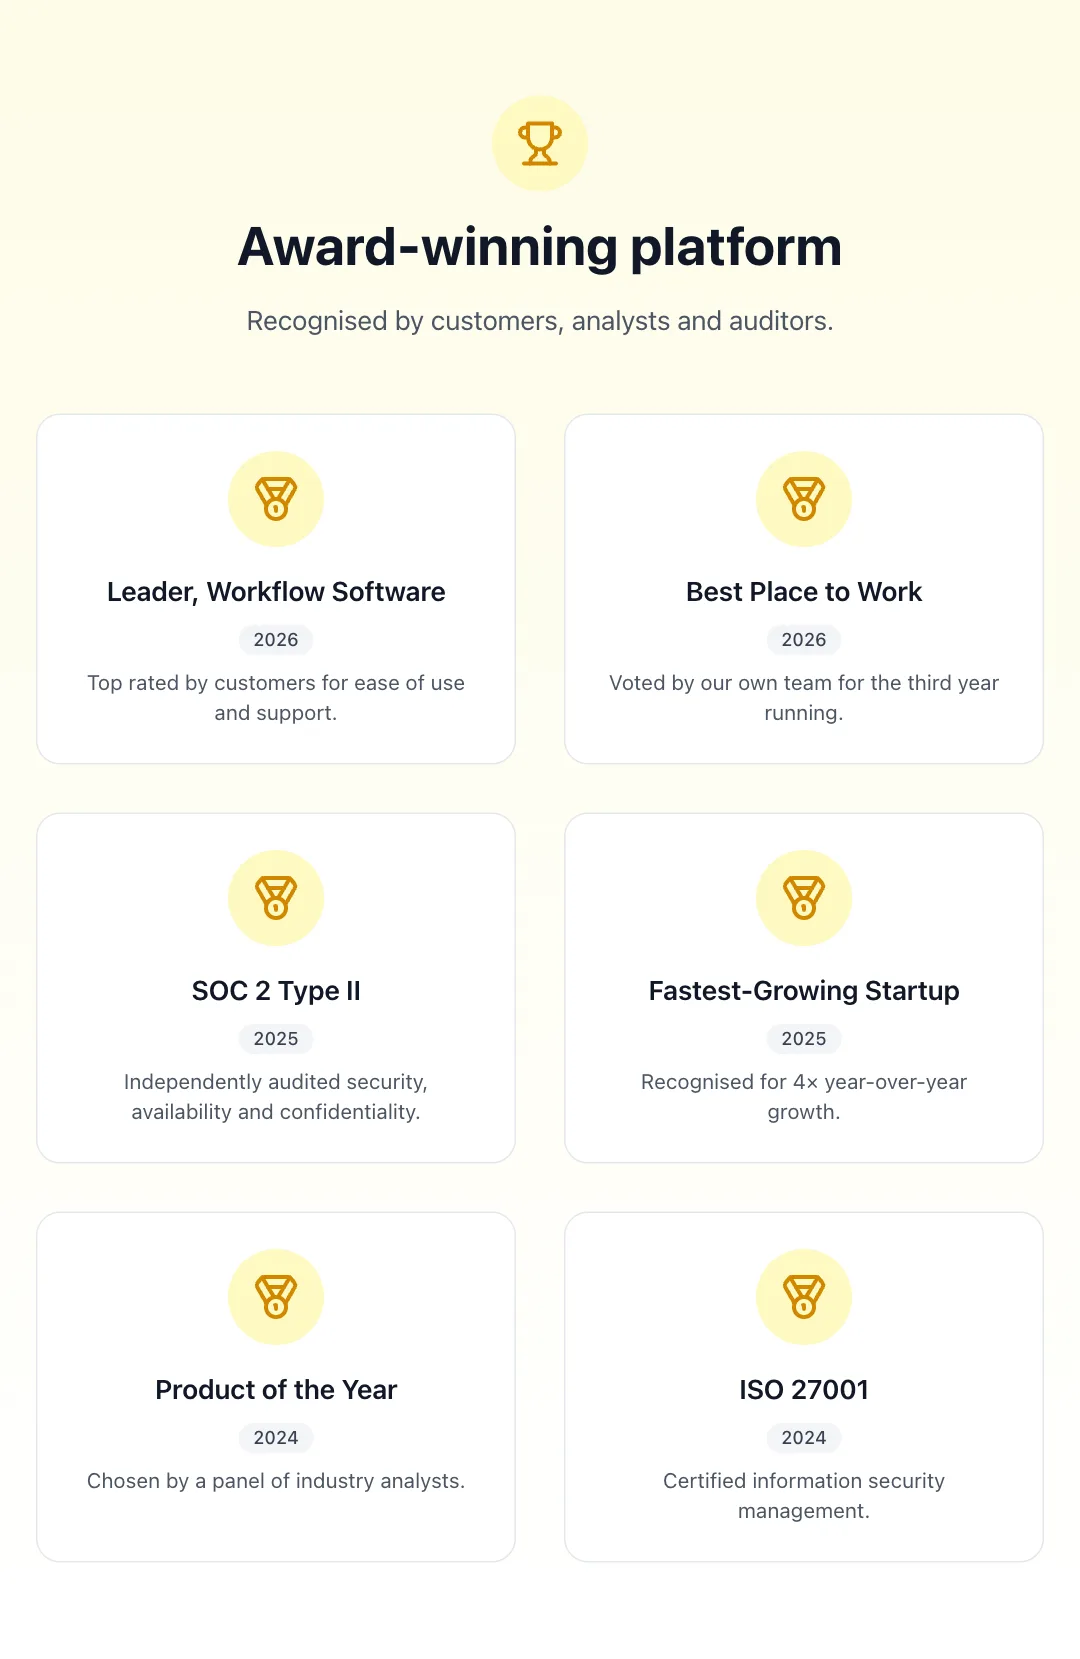
Awards and certifications as a featured showcase, a grid, a year timeline or compact badges.
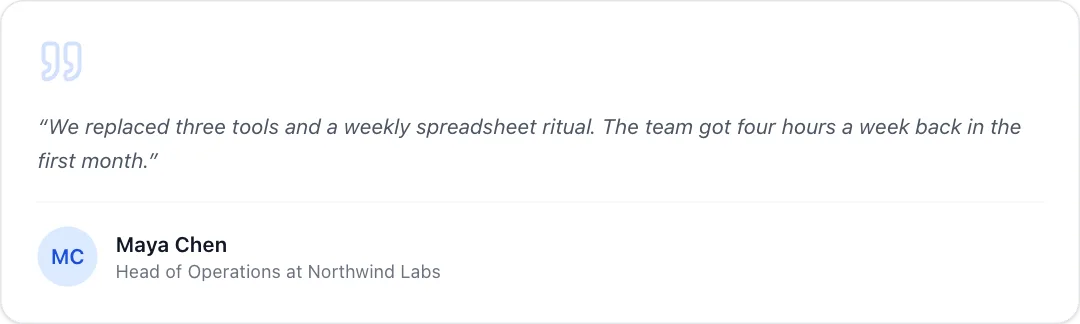
A customer quote card that rises into view with the author's avatar, role and company.
A grid of customer logos that fade in one by one and light up on hover.
Customer logos scrolling in an endless CSS loop, in one or two rows, pausing on hover.
A burst of confetti for a win moment, fired by a prop or the built-in button.
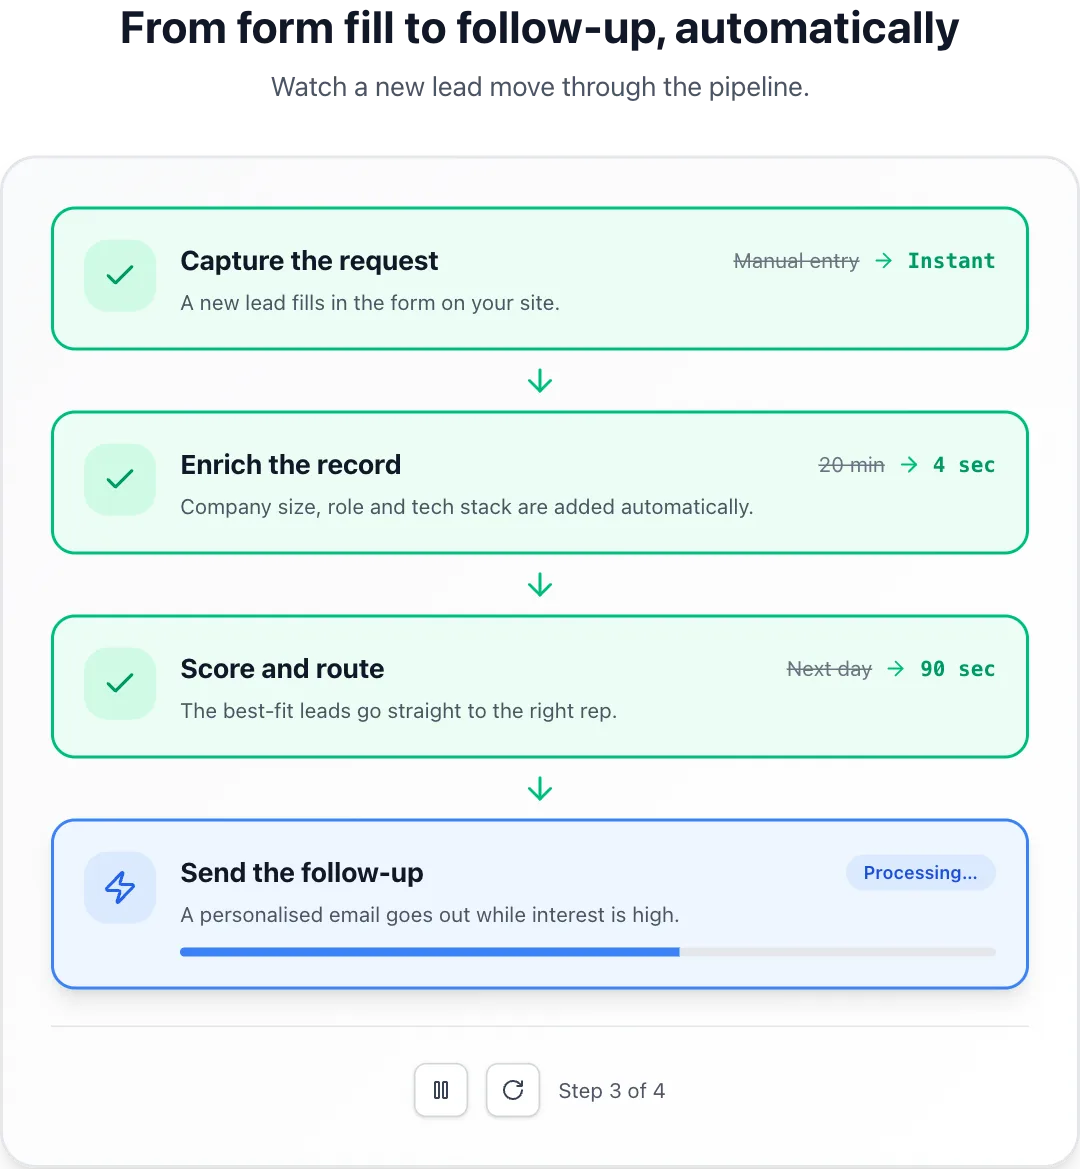
Steps that complete one after another with a progress bar and before-and-after metrics.
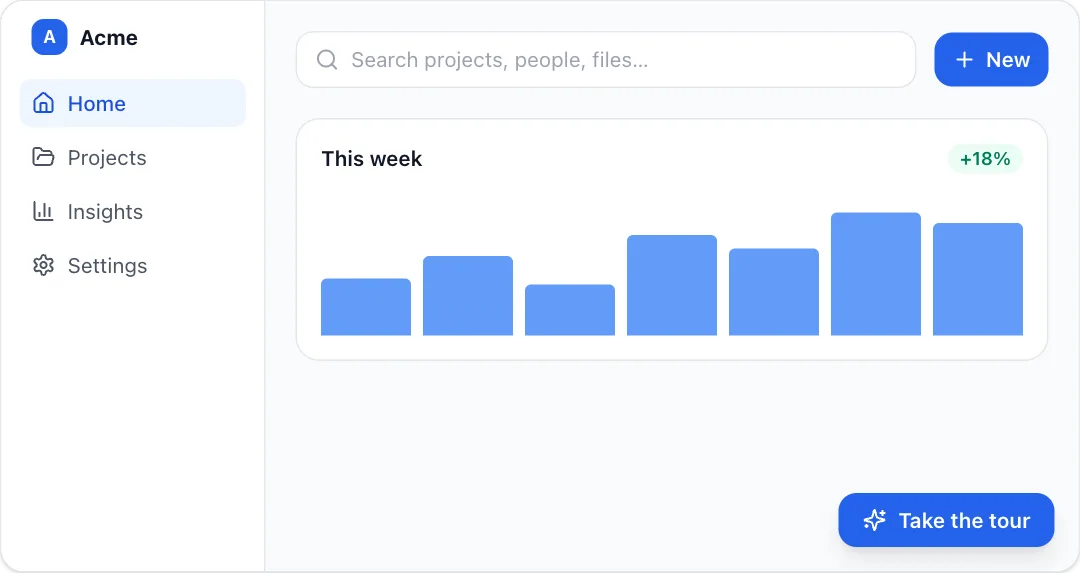
A guided product tour that dims the page and spotlights each element with a tooltip.
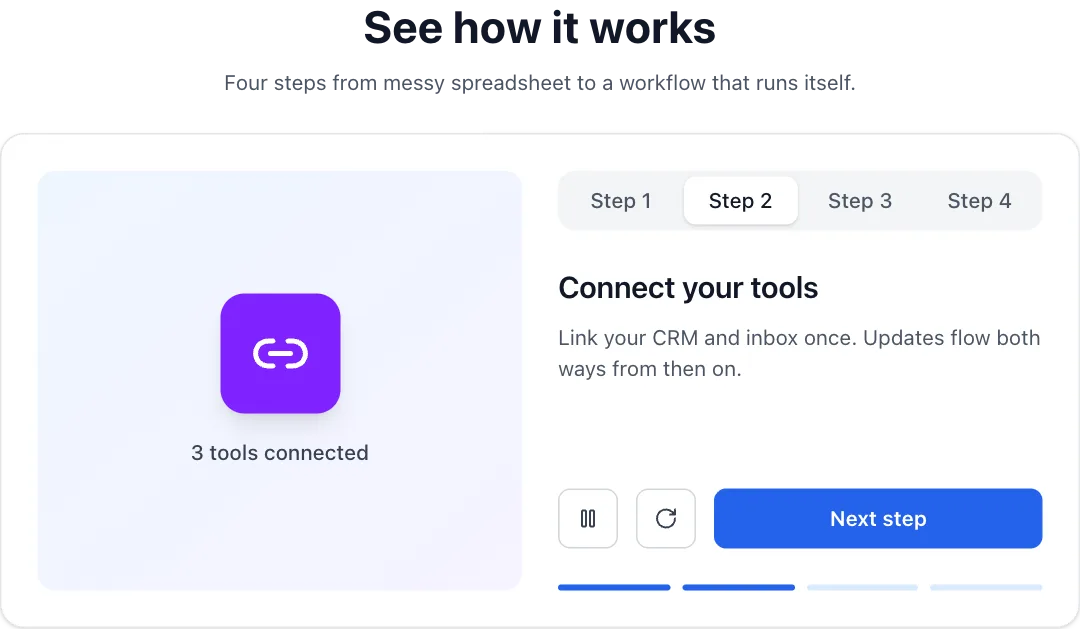
A step-by-step product demo whose visual swaps per tab and auto-plays through the steps.
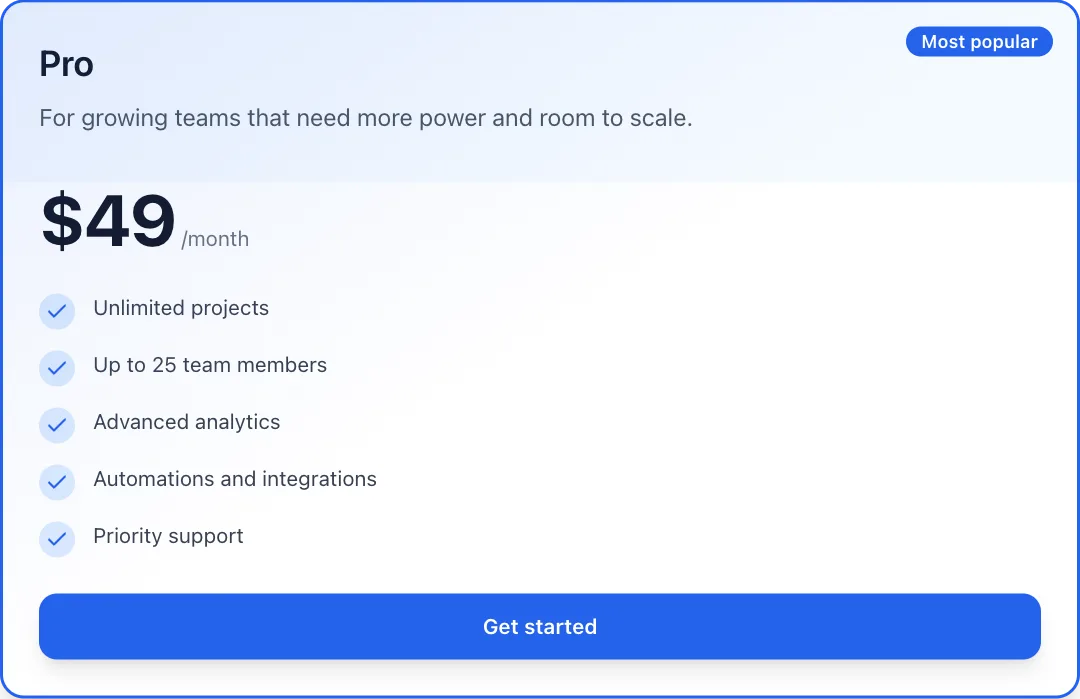
A single plan card that rises into view, ticks in its features and lifts on hover.
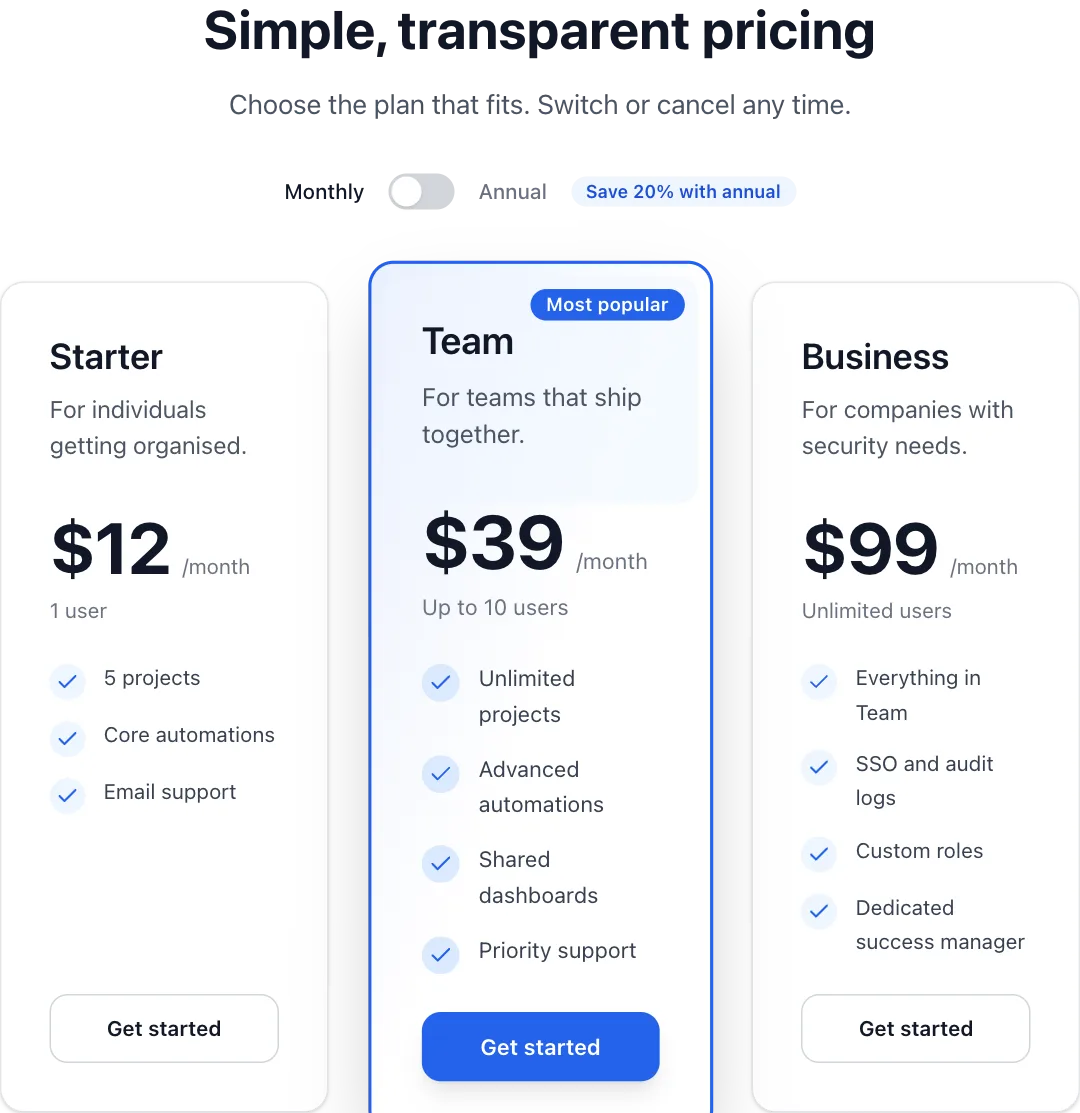
Plan cards with a monthly or annual switch that animates every price.
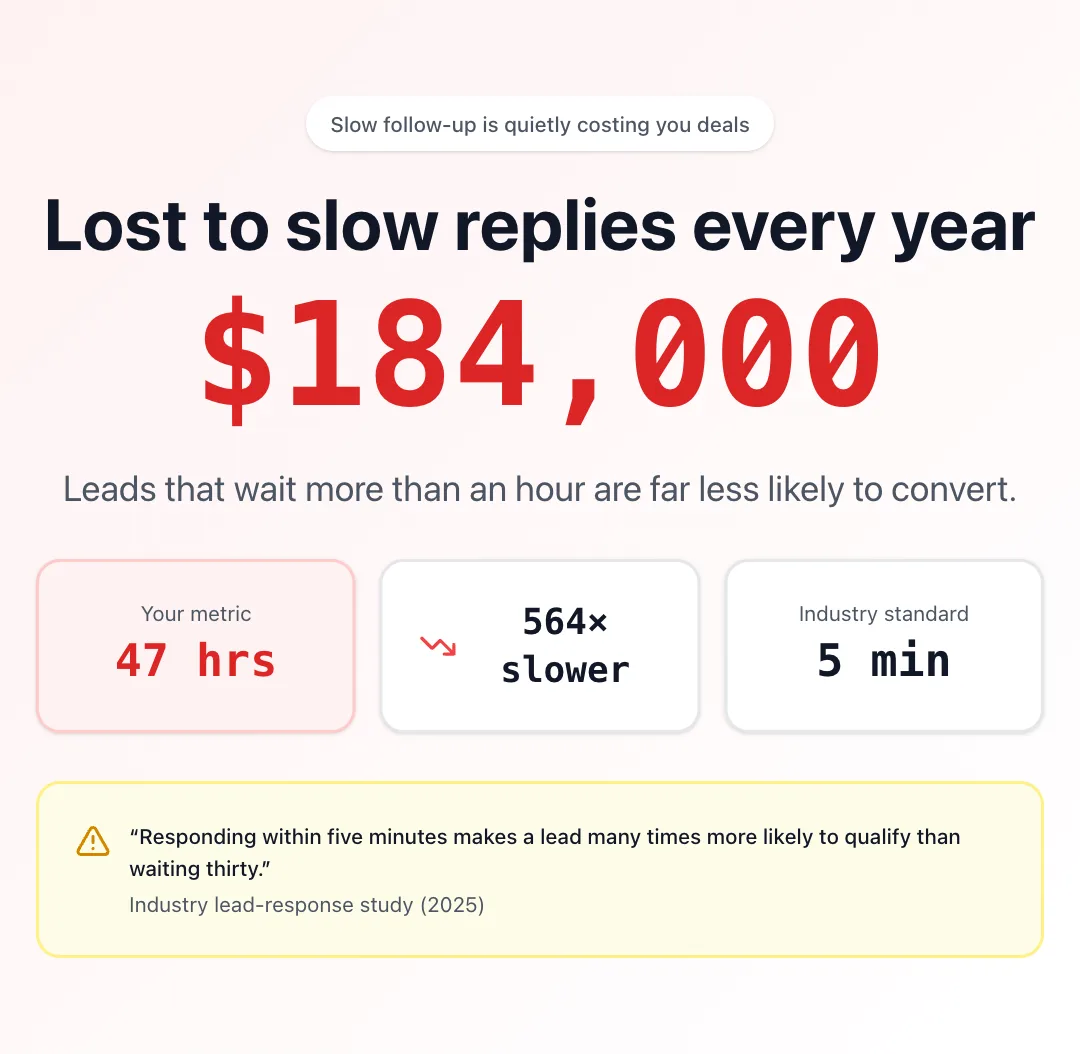
A hero that frames the problem with one big number, a gap to benchmark and a research quote.
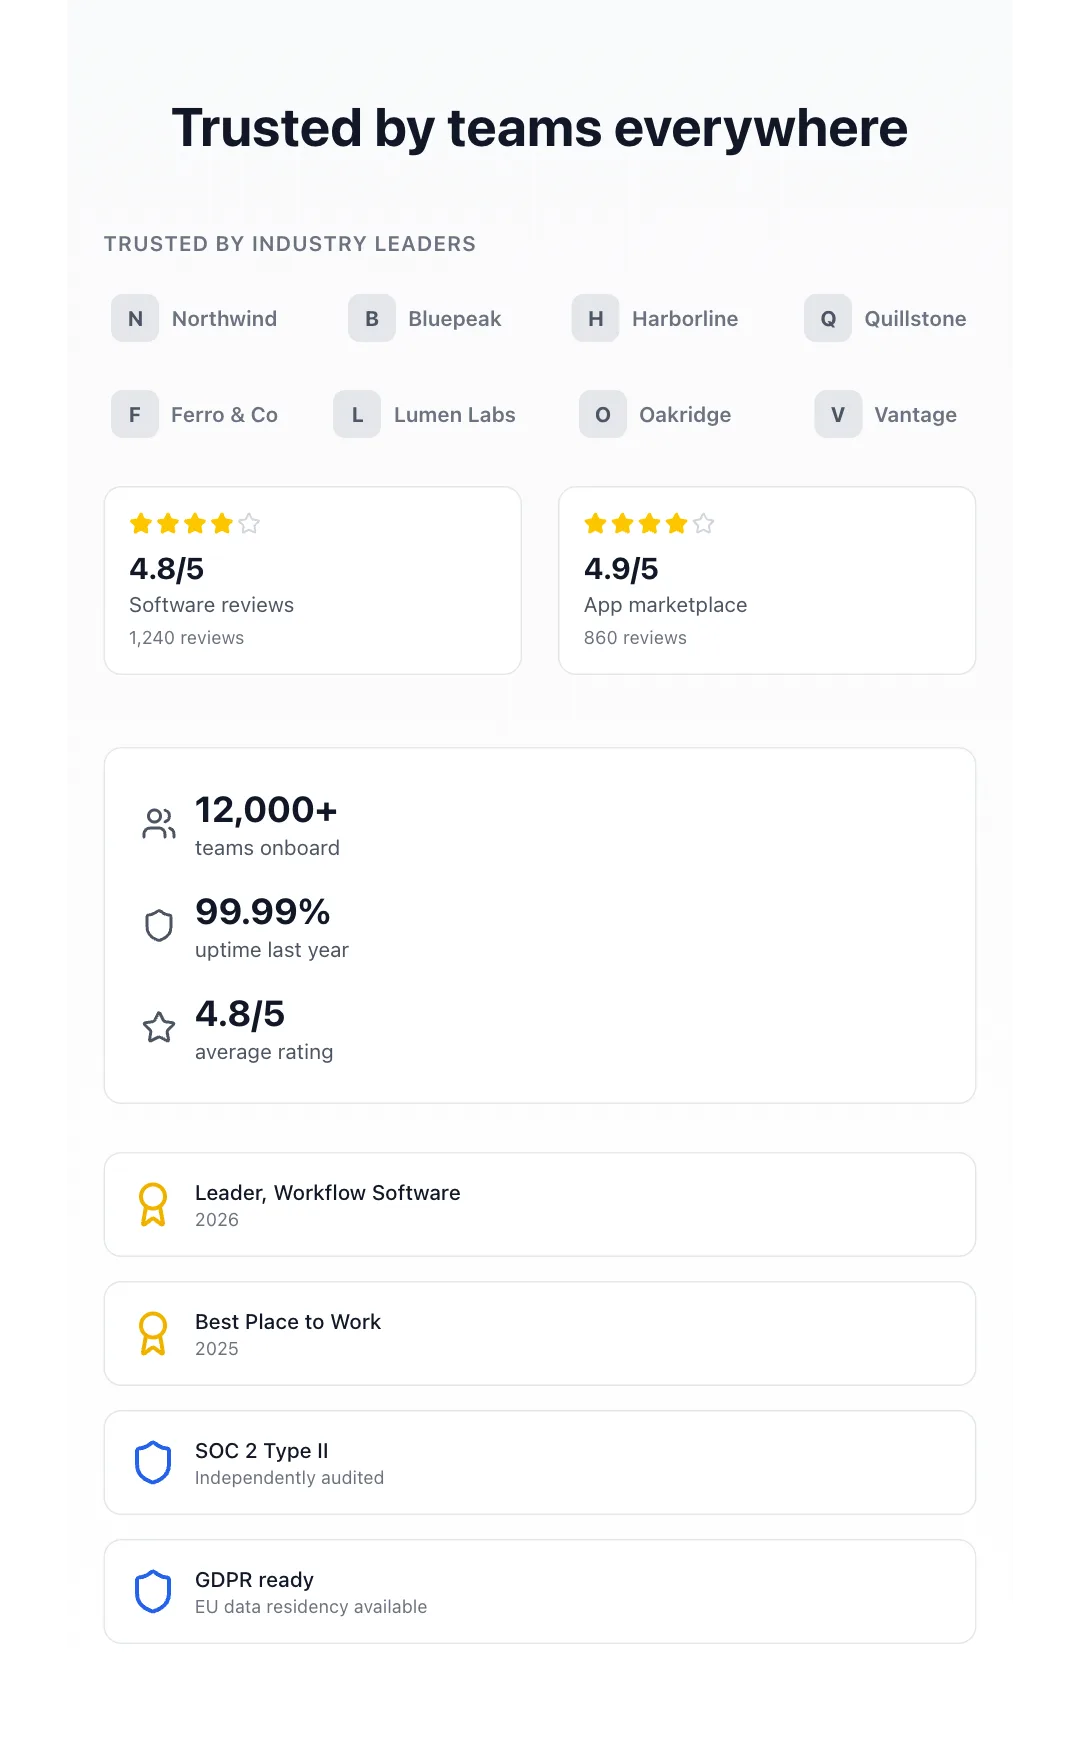
Customers, ratings, awards, security badges and metrics combined in one trust section.
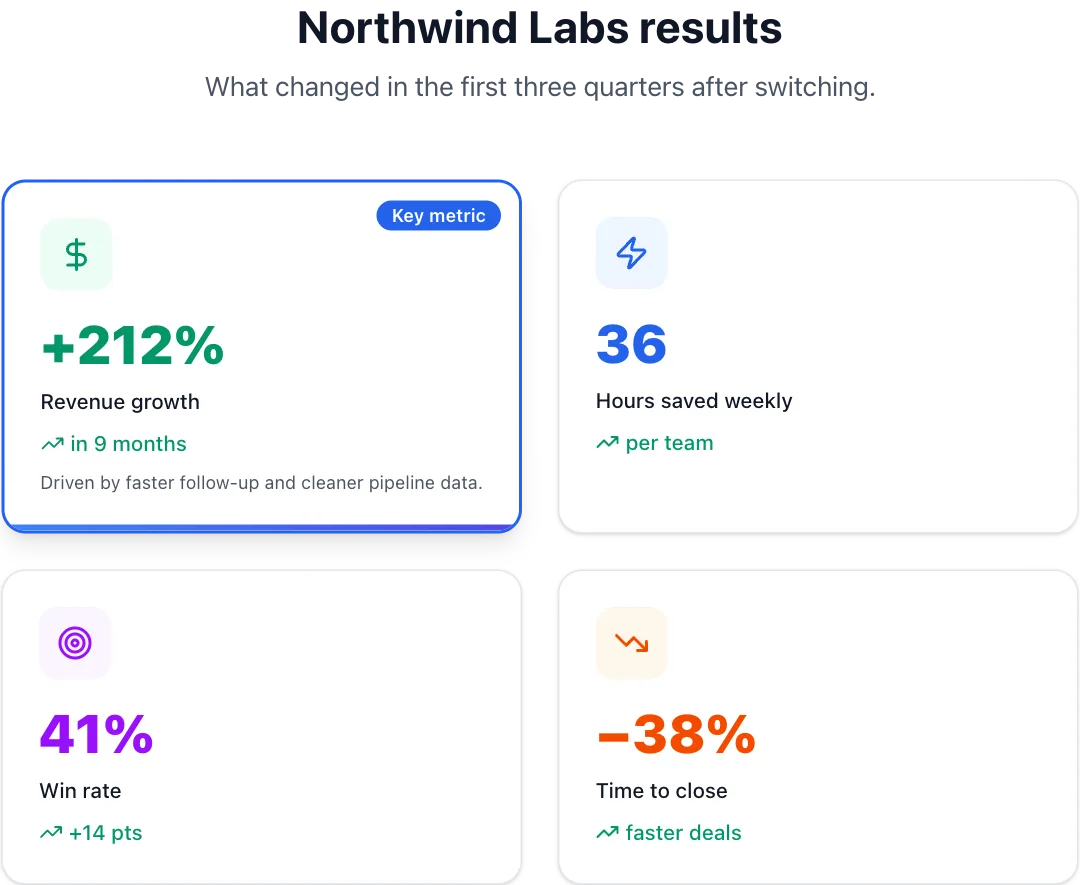
A customer's results as springy metric cards, a hero number or a compact row.
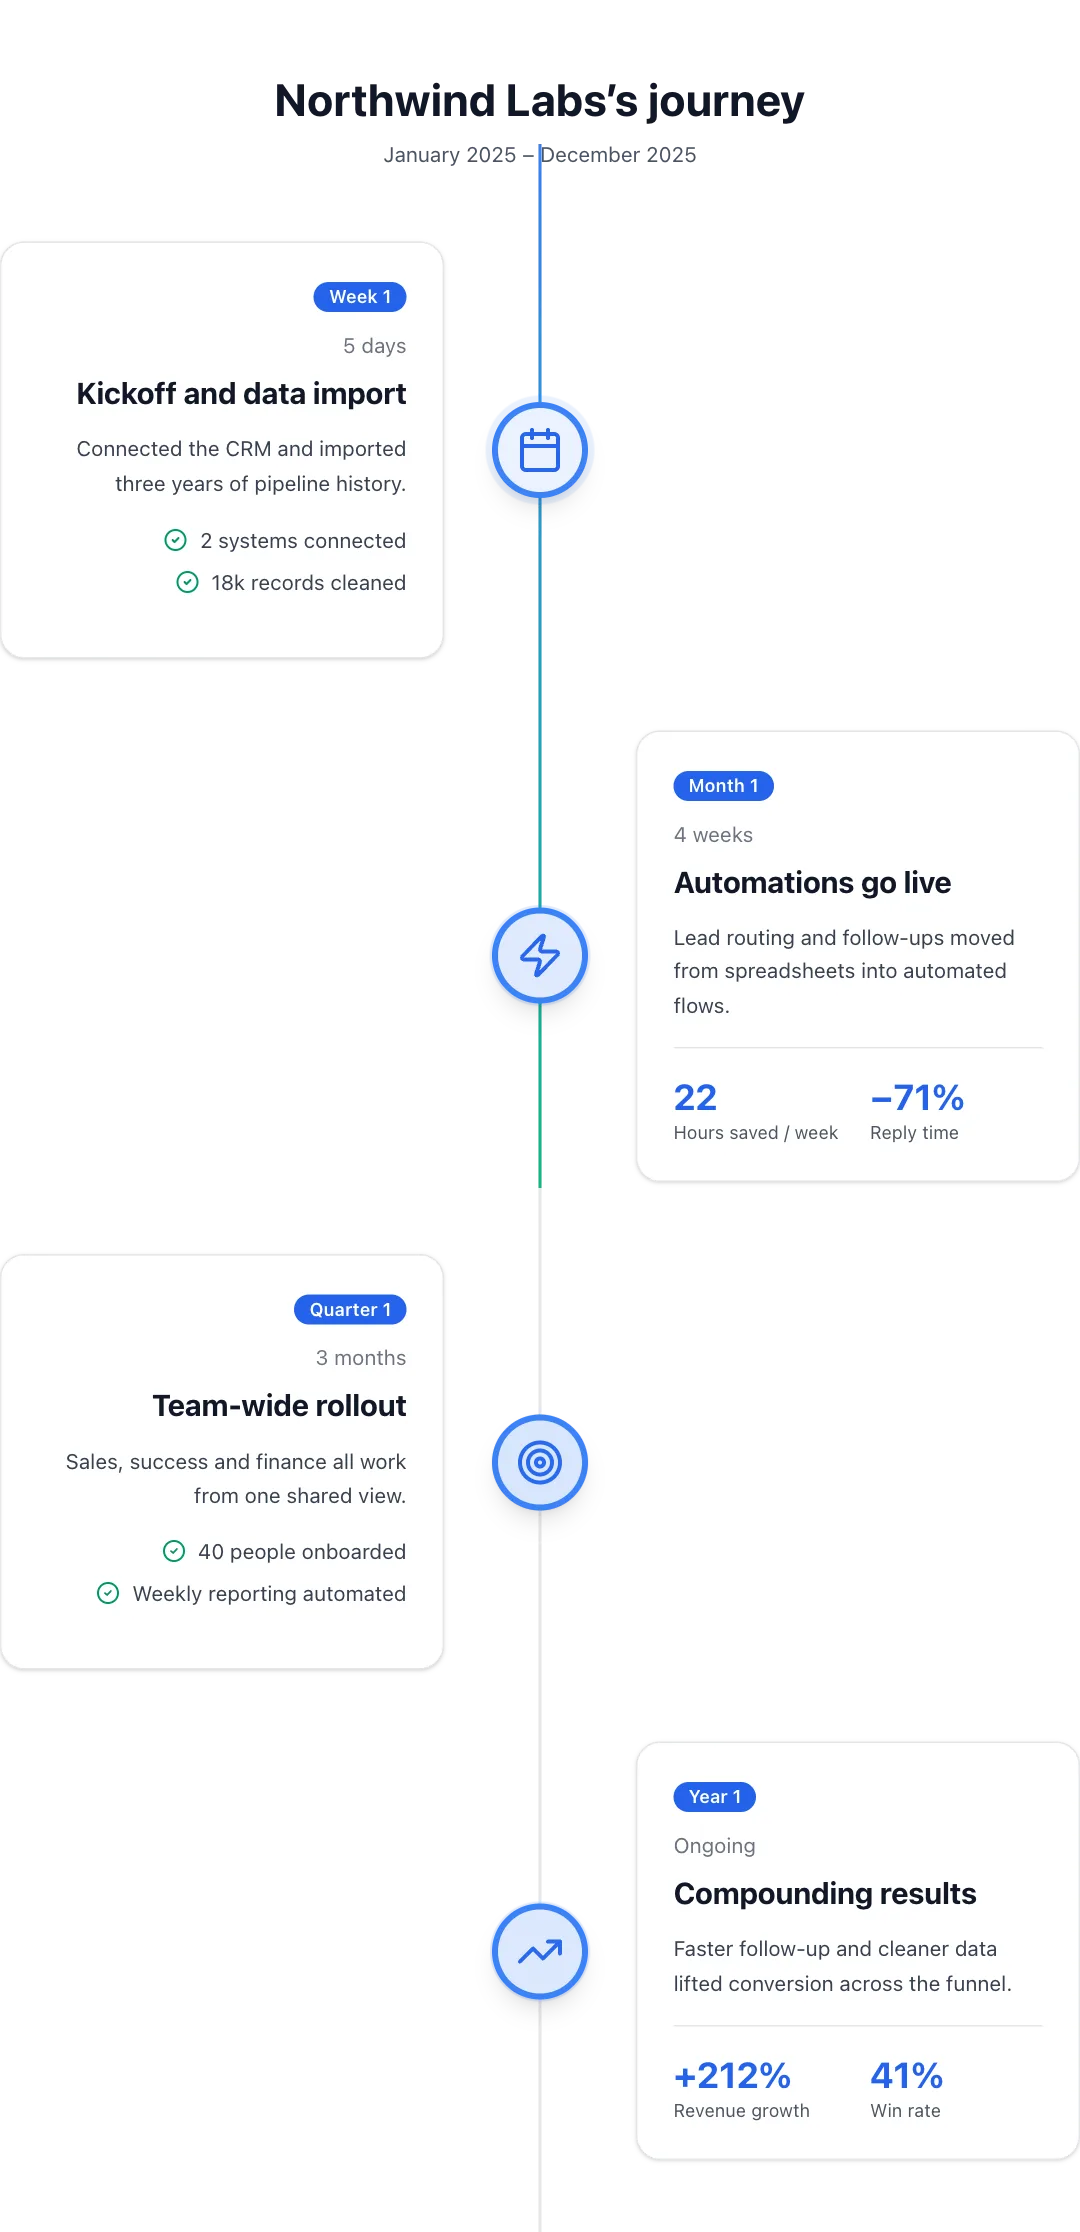
A customer's journey as phase cards along a line that fills as you scroll.
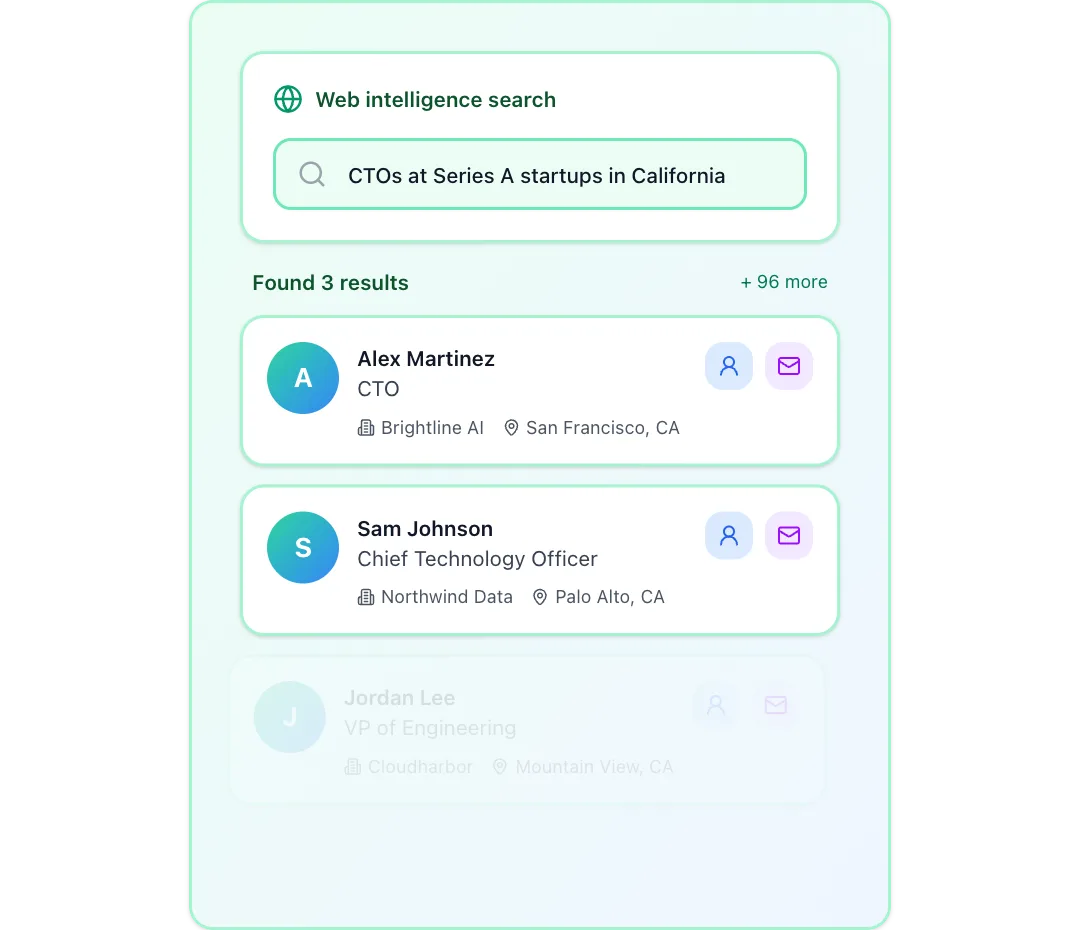
A search query types itself, the web is scanned step by step, and matching profiles stream in with a summary.
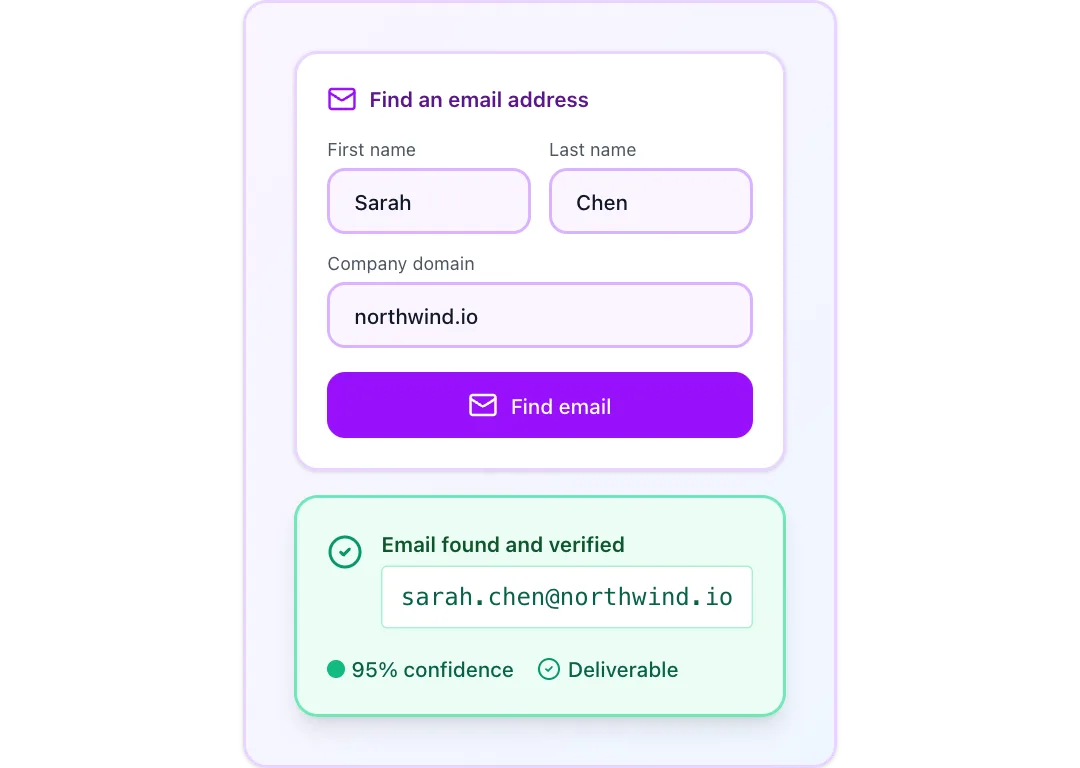
A name and domain are entered, checks run one by one, and a verified email appears with its confidence score.
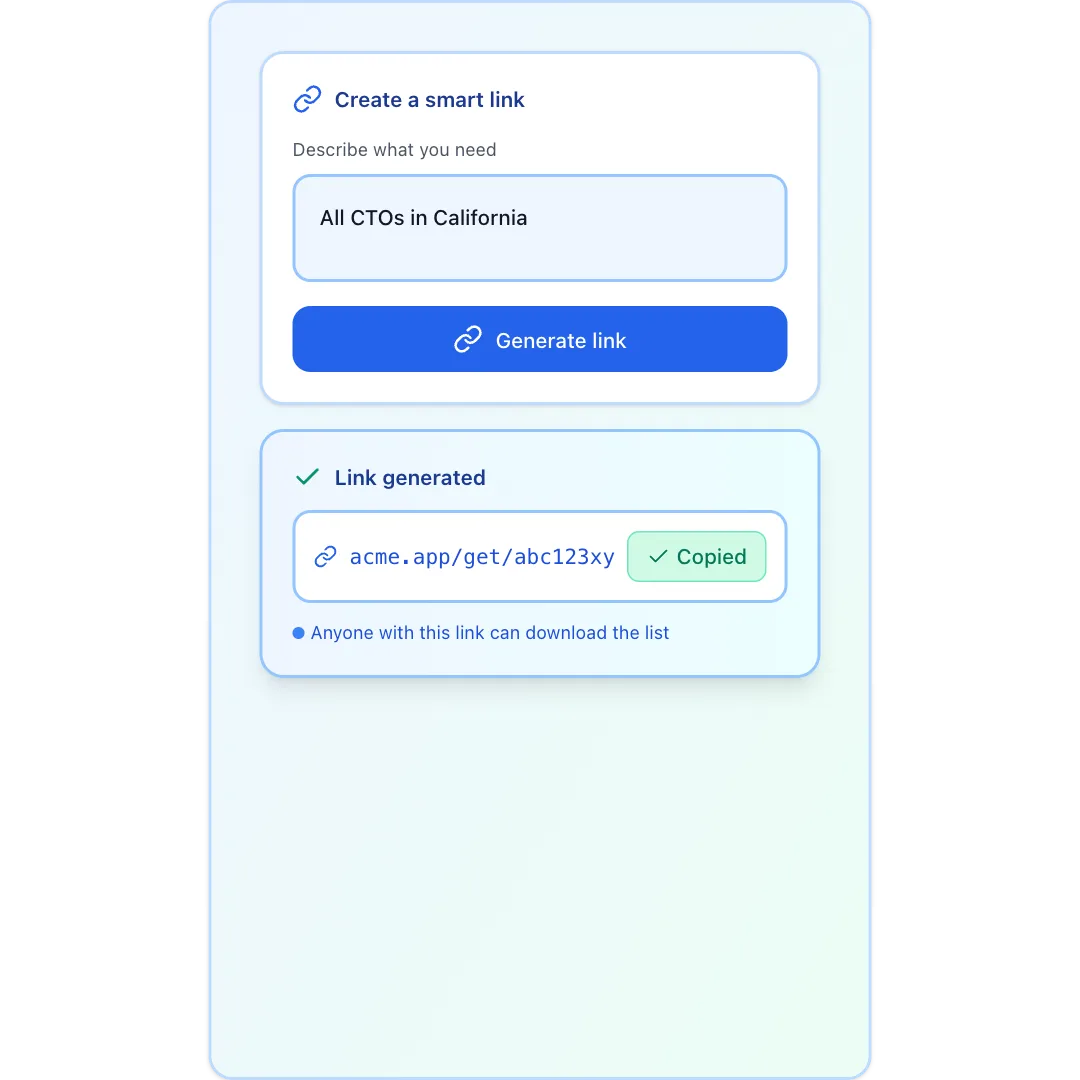
A prompt becomes a shareable link that generates a fresh file for whoever opens it.
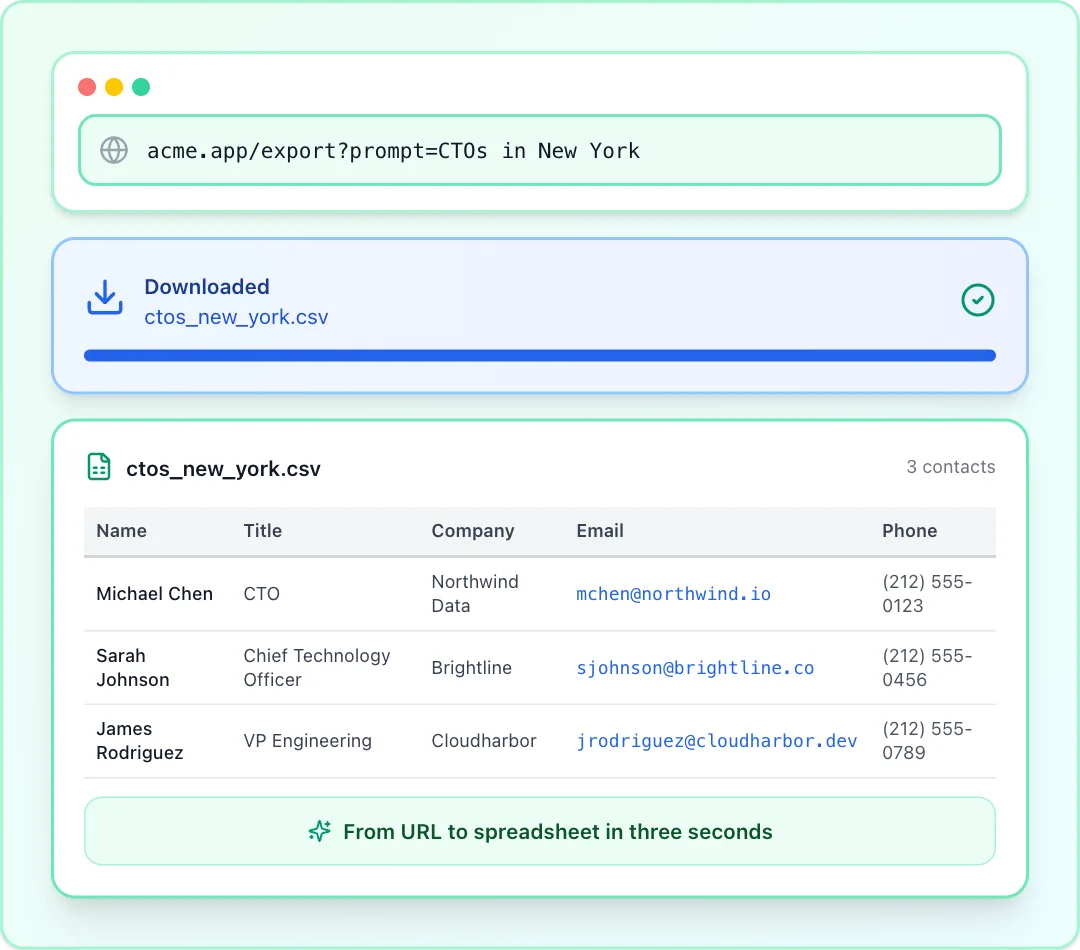
A URL with a plain-language prompt is typed into the browser, a file downloads, and its rows open in a table.
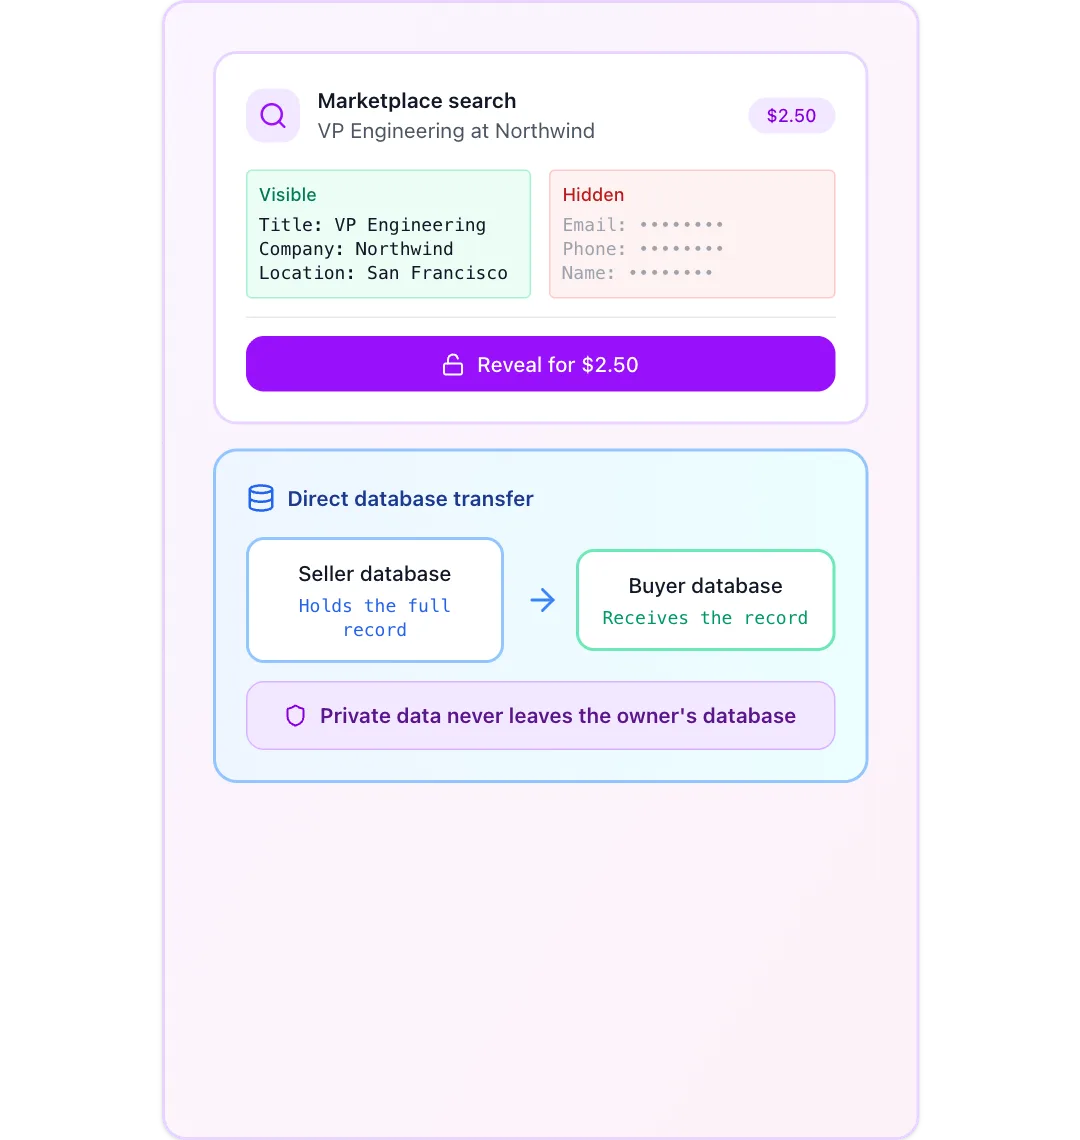
A record shows its public fields while private fields stay locked until a paid reveal passes each privacy check.
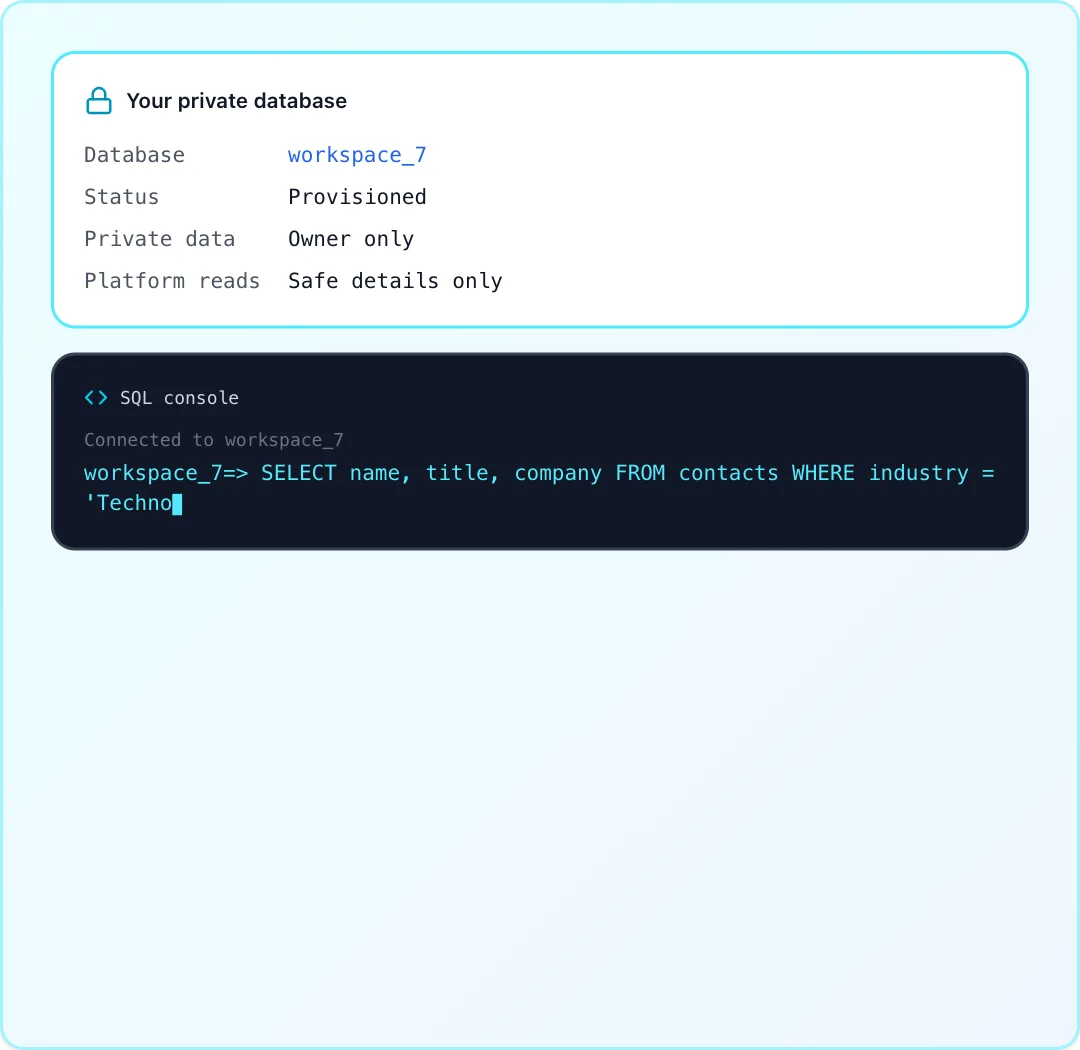
A SQL query runs in a console against a shared workspace and the result table prints out line by line.
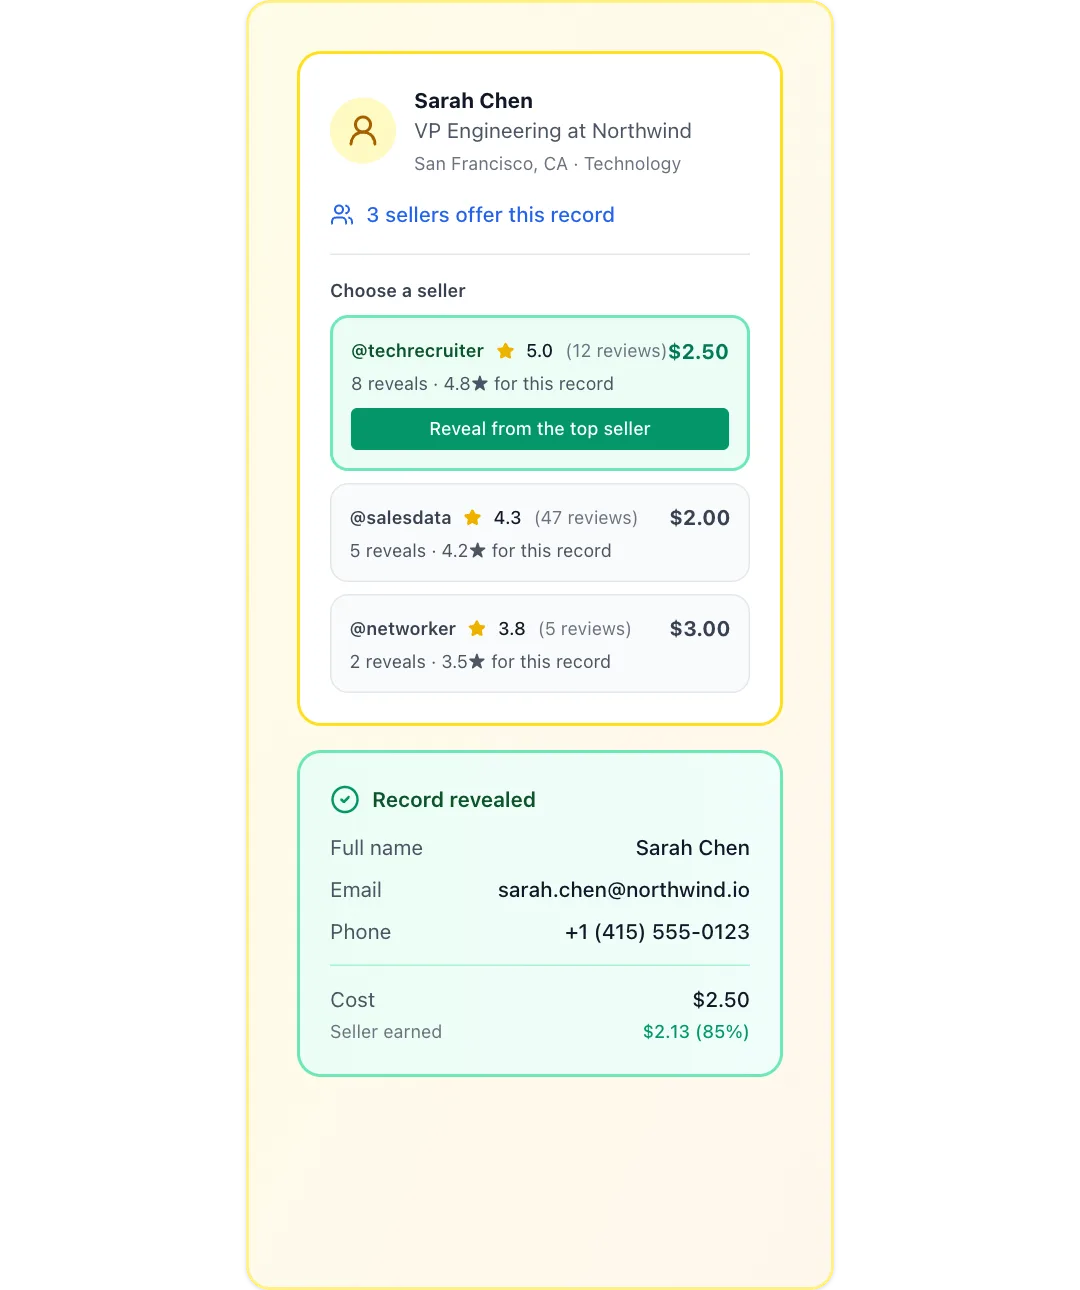
Several sellers offer the same record, the best one is picked, the record is revealed and the seller's earnings add up.
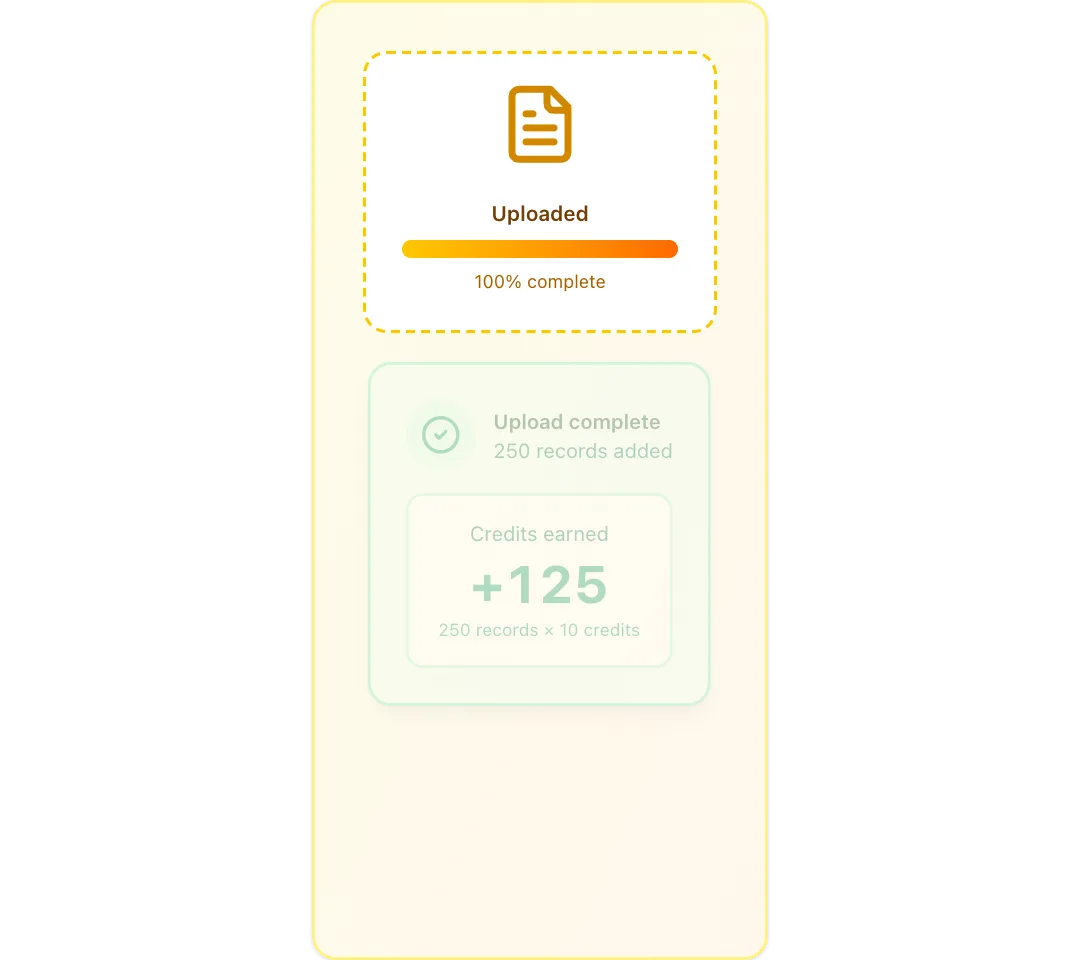
A file uploads and is checked, earned credits count up, and the uploader climbs the leaderboard.
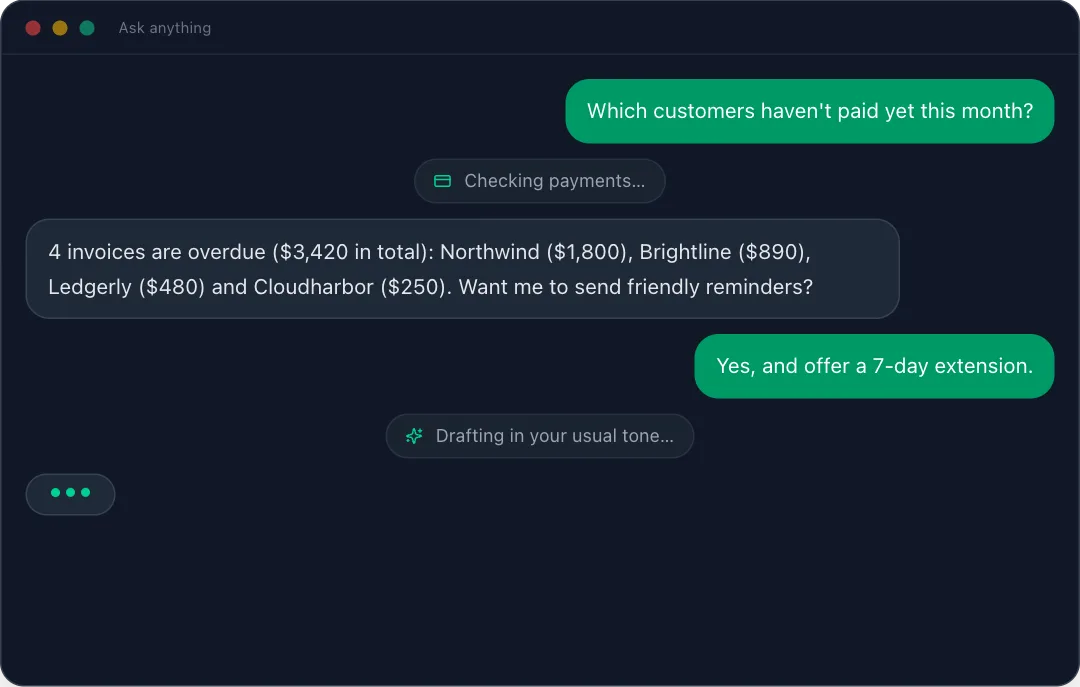
A chat with an assistant plays out in a dark app window, with each tool call shown as it runs.
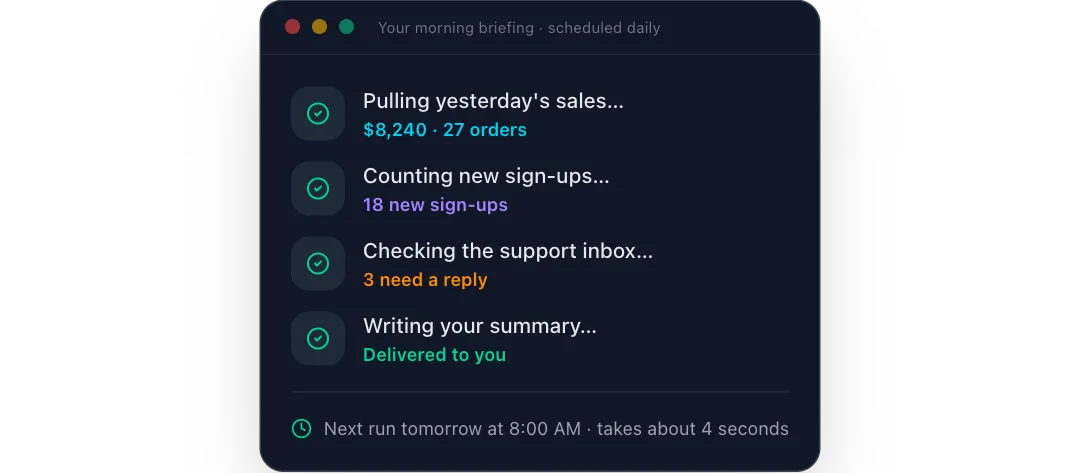
A scheduled morning briefing gathers sales, sign-ups and inbox counts in turn and is delivered.
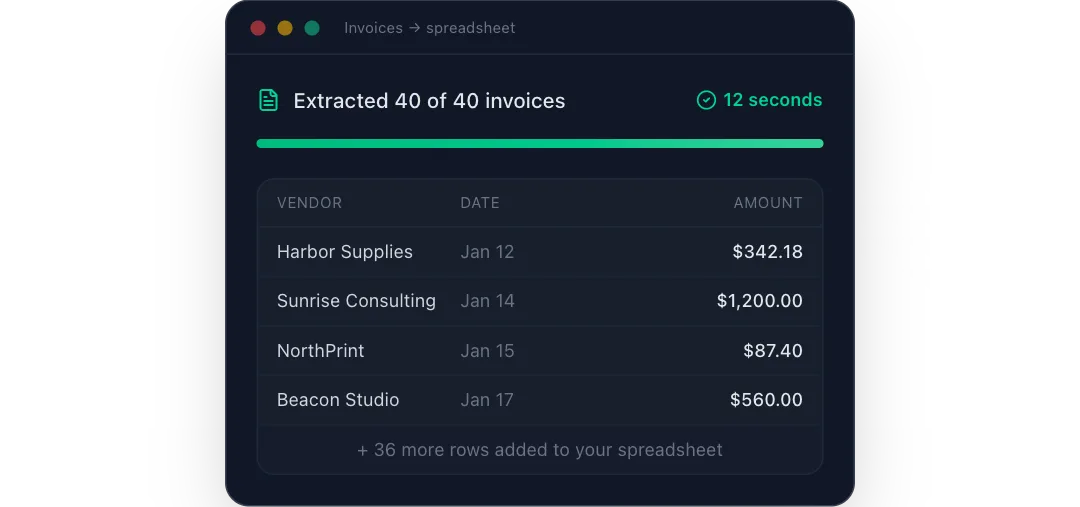
A stack of invoices is read one by one while clean spreadsheet rows fill in under a progress bar.
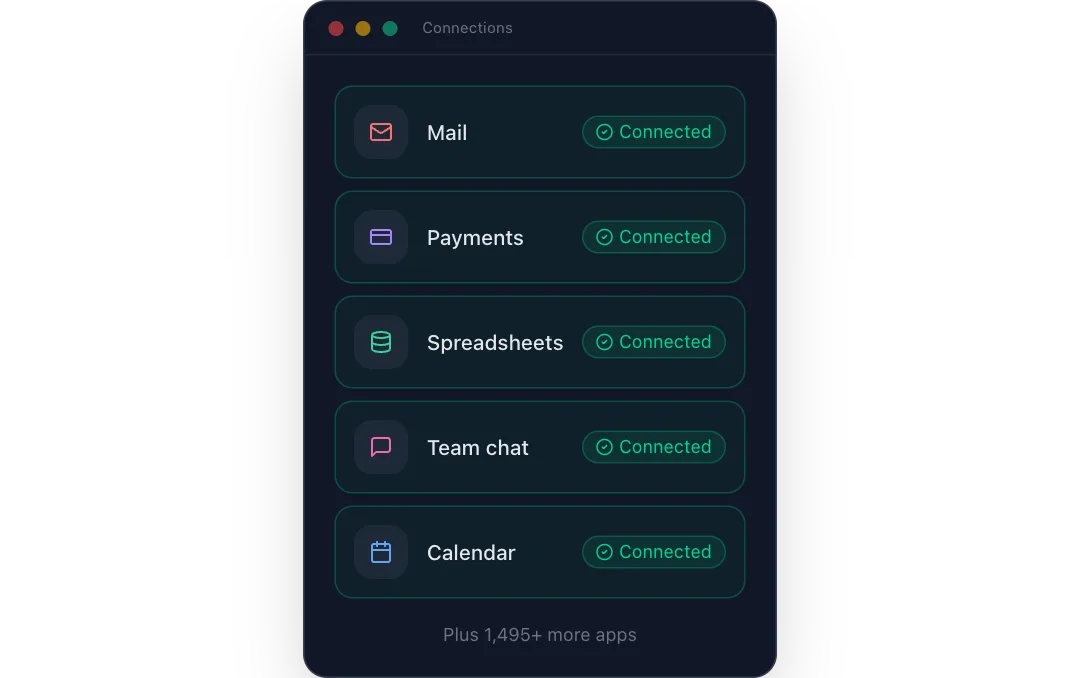
A list of apps connects one after another, each switching to a green connected badge.
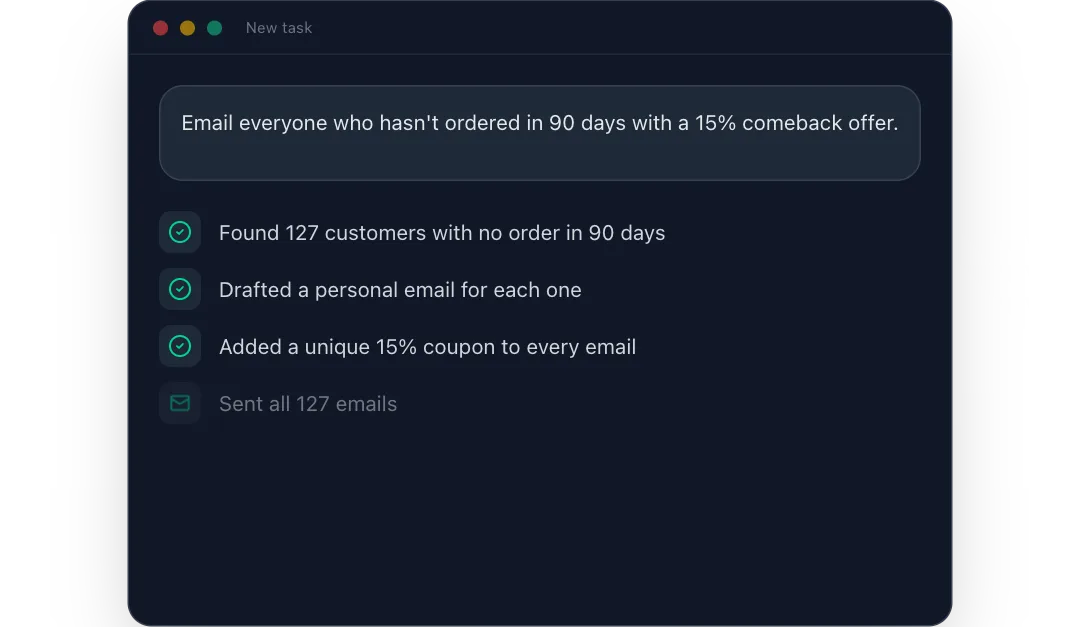
A typed request becomes a win-back email campaign that is drafted, couponed and sent, then shows its results.

Six numbered how-it-works steps fade up in turn as the section scrolls into view.

A grid of feature cards with icons fades up in a quick stagger as the section scrolls into view.
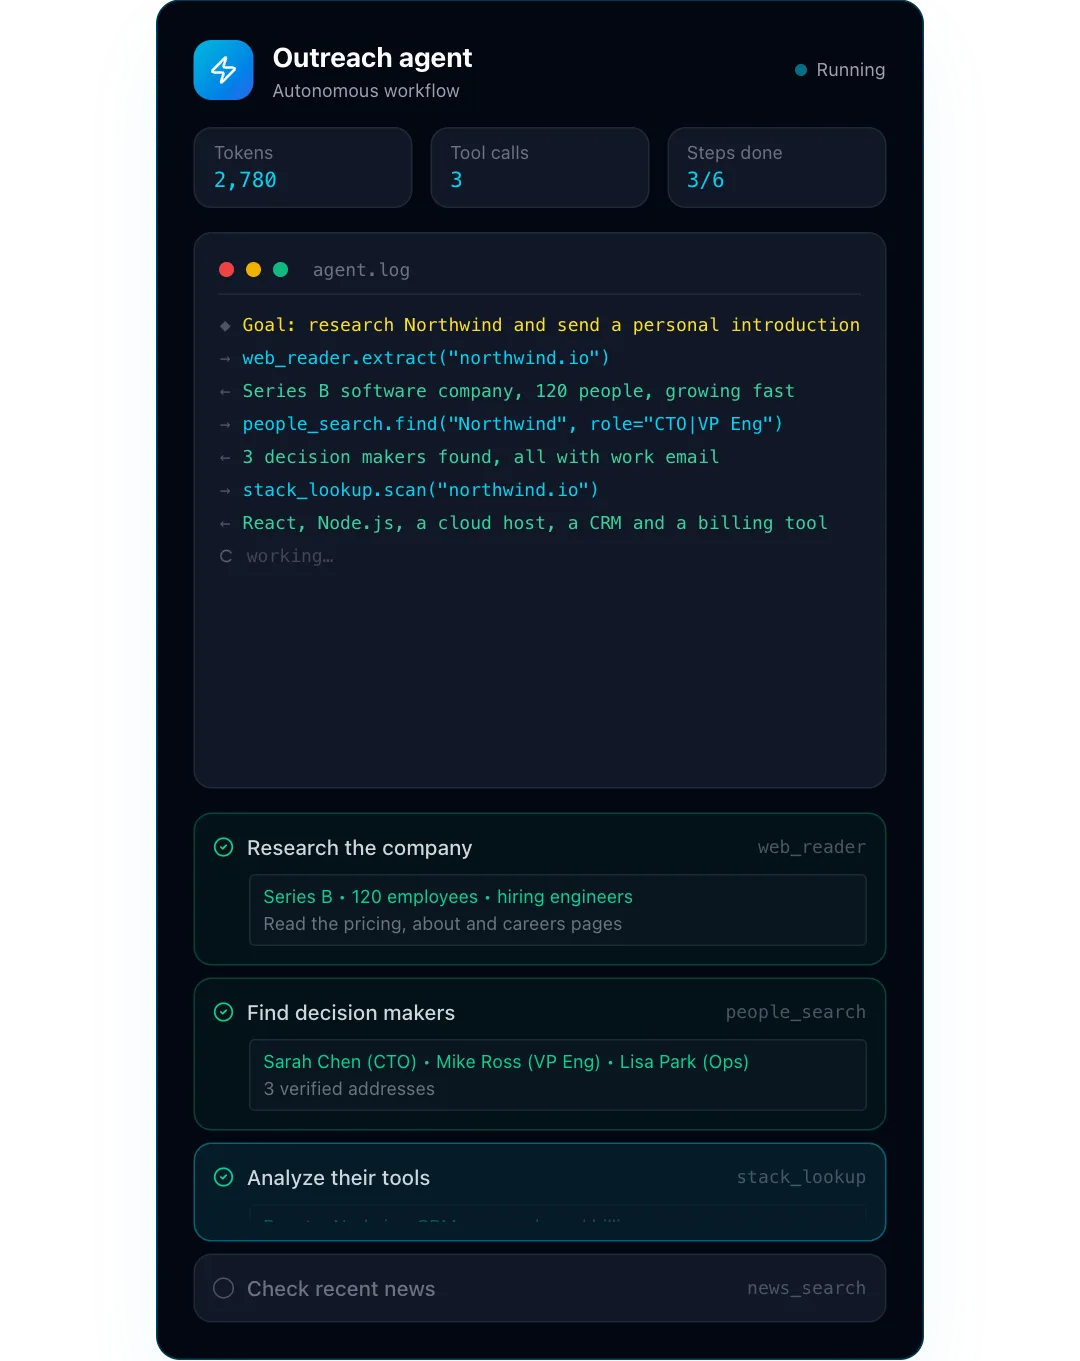
An autonomous agent works through a task list while its thoughts and tool calls stream into a log and each step lands with a result.
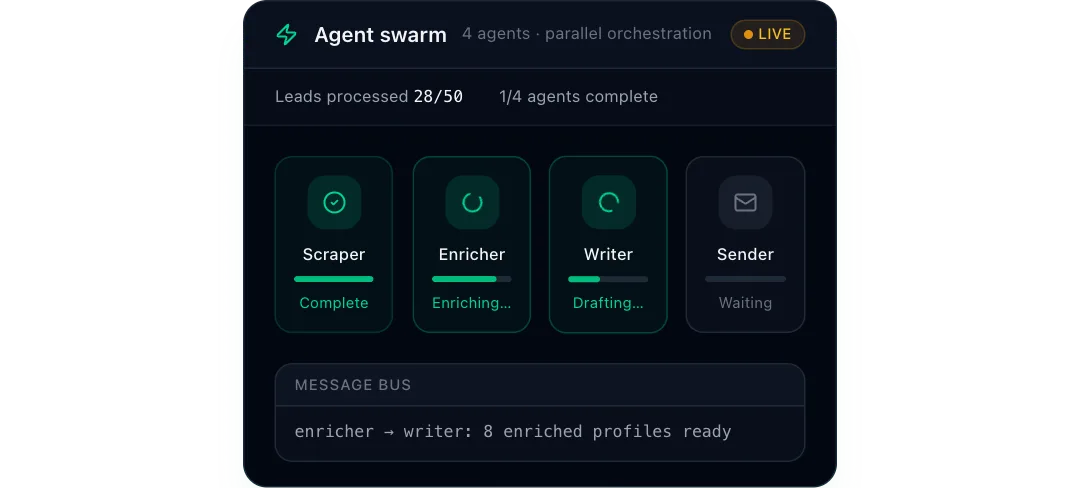
Four agents hand work down a pipeline in parallel, each filling its progress bar while a message bus narrates the hand-offs.
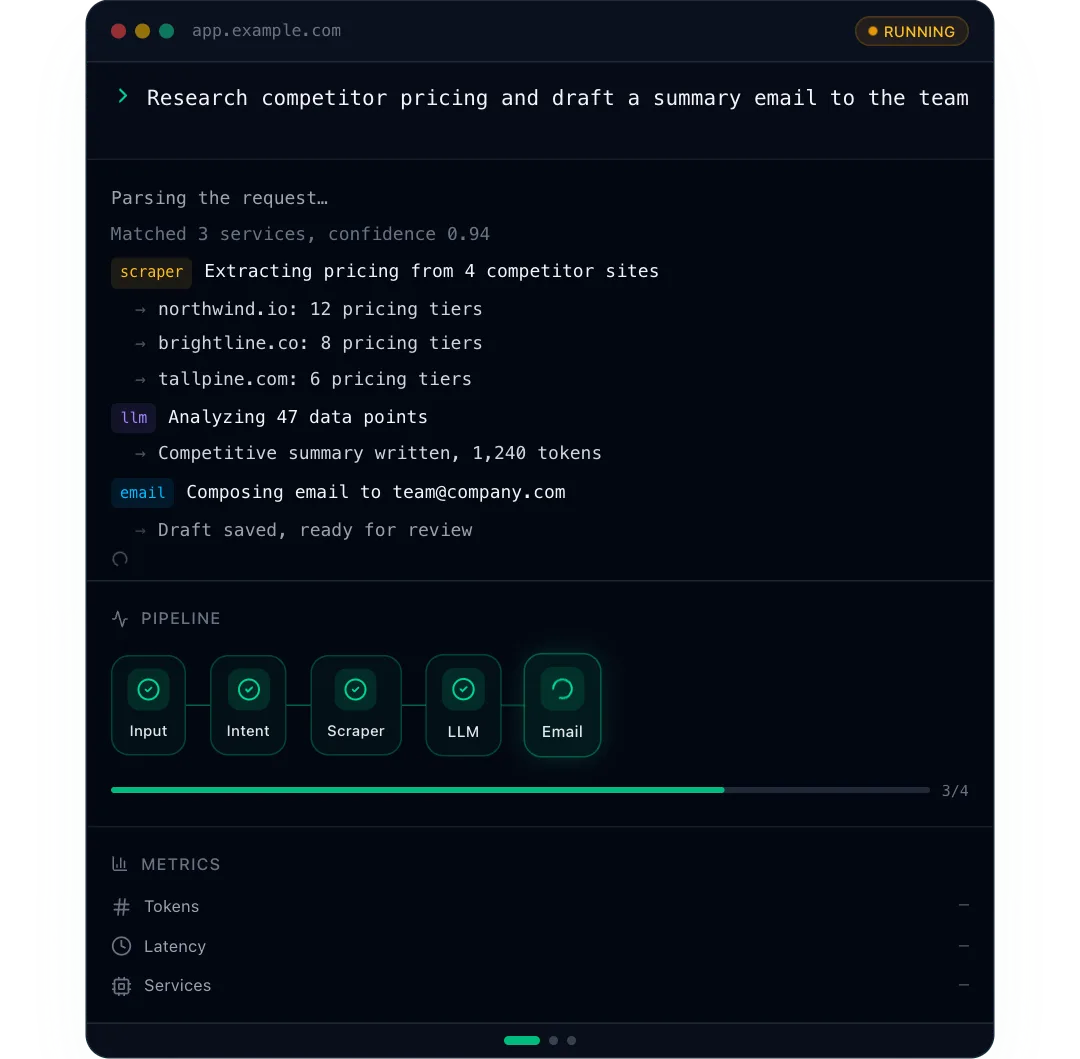
A plain-English request types itself, service nodes light up in turn as their logs stream, and the run's metrics land at the end.
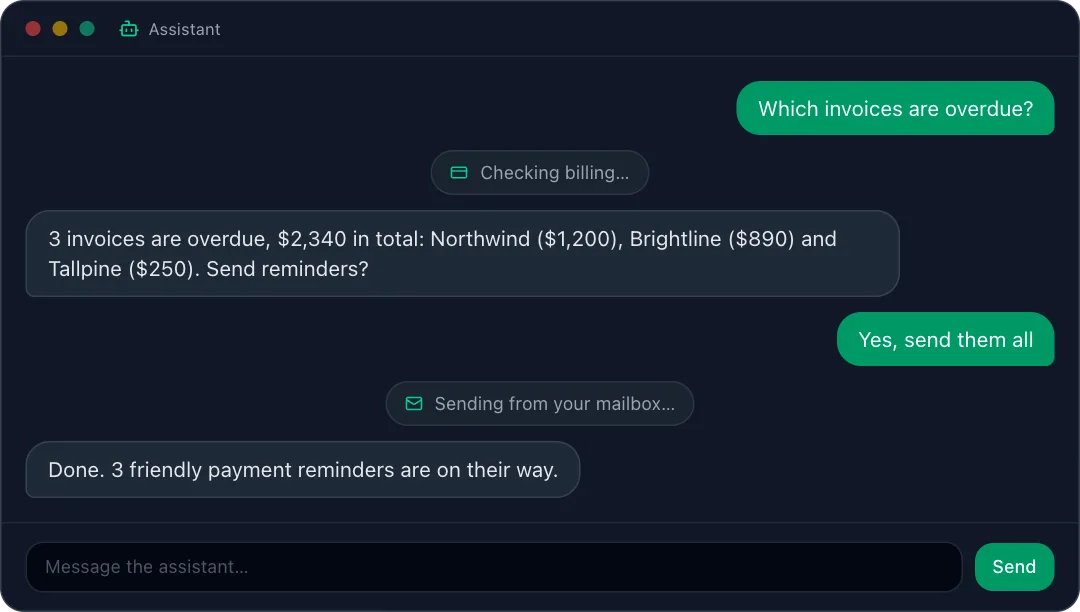
A looping chat where the assistant calls tools between replies, with tool chips and a typing indicator.
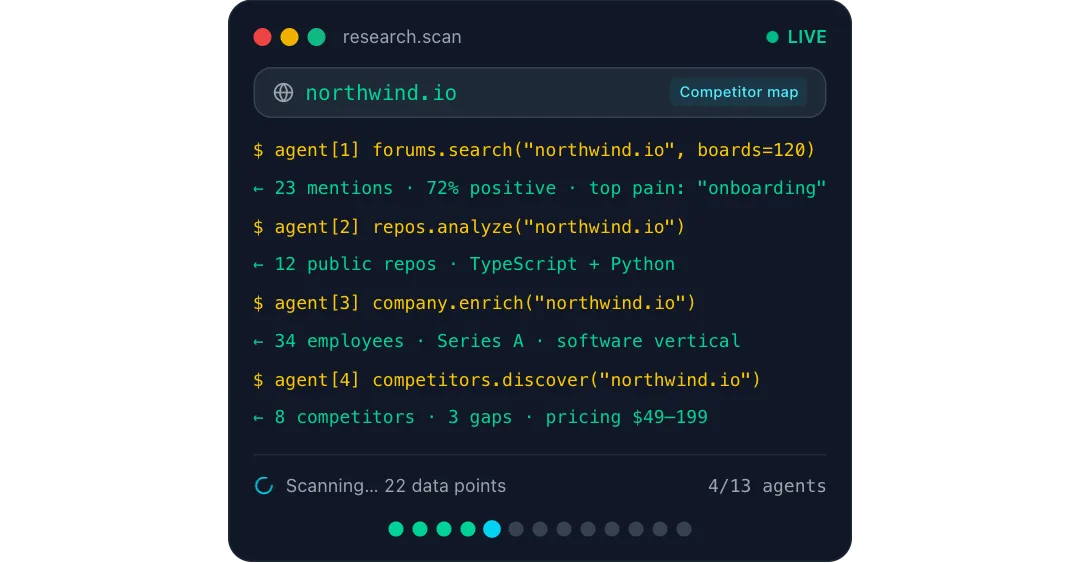
A domain types itself into a terminal, a swarm of research agents runs in sequence, and a row of dots fills as data points pile up.
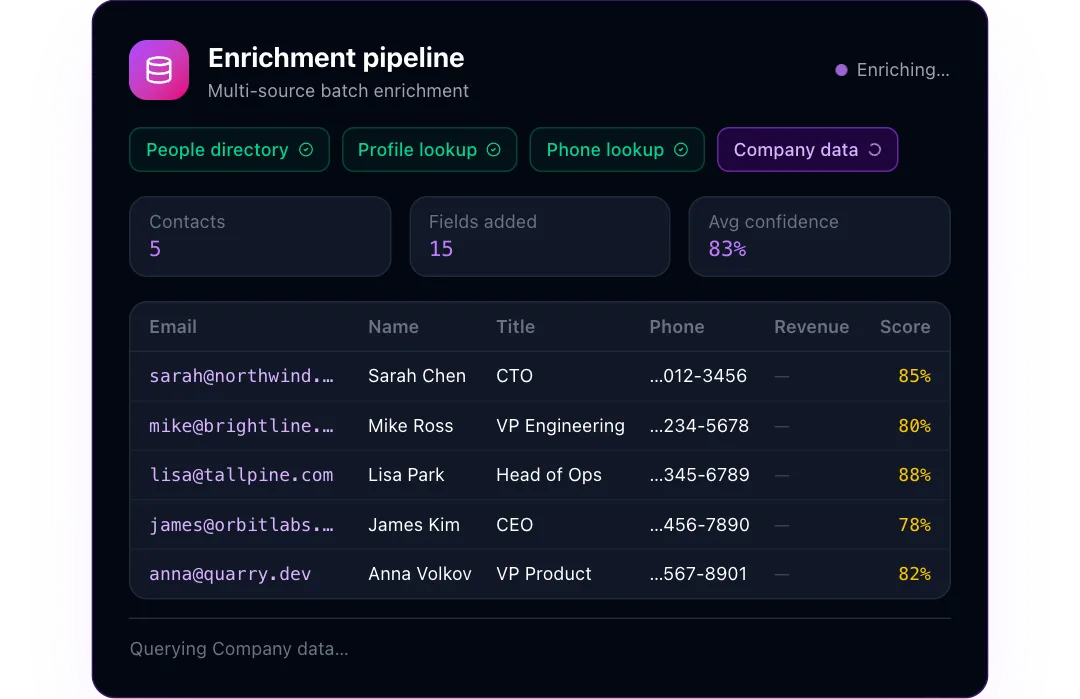
Bare email addresses fill in column by column as each data source answers, with a live confidence score per row.
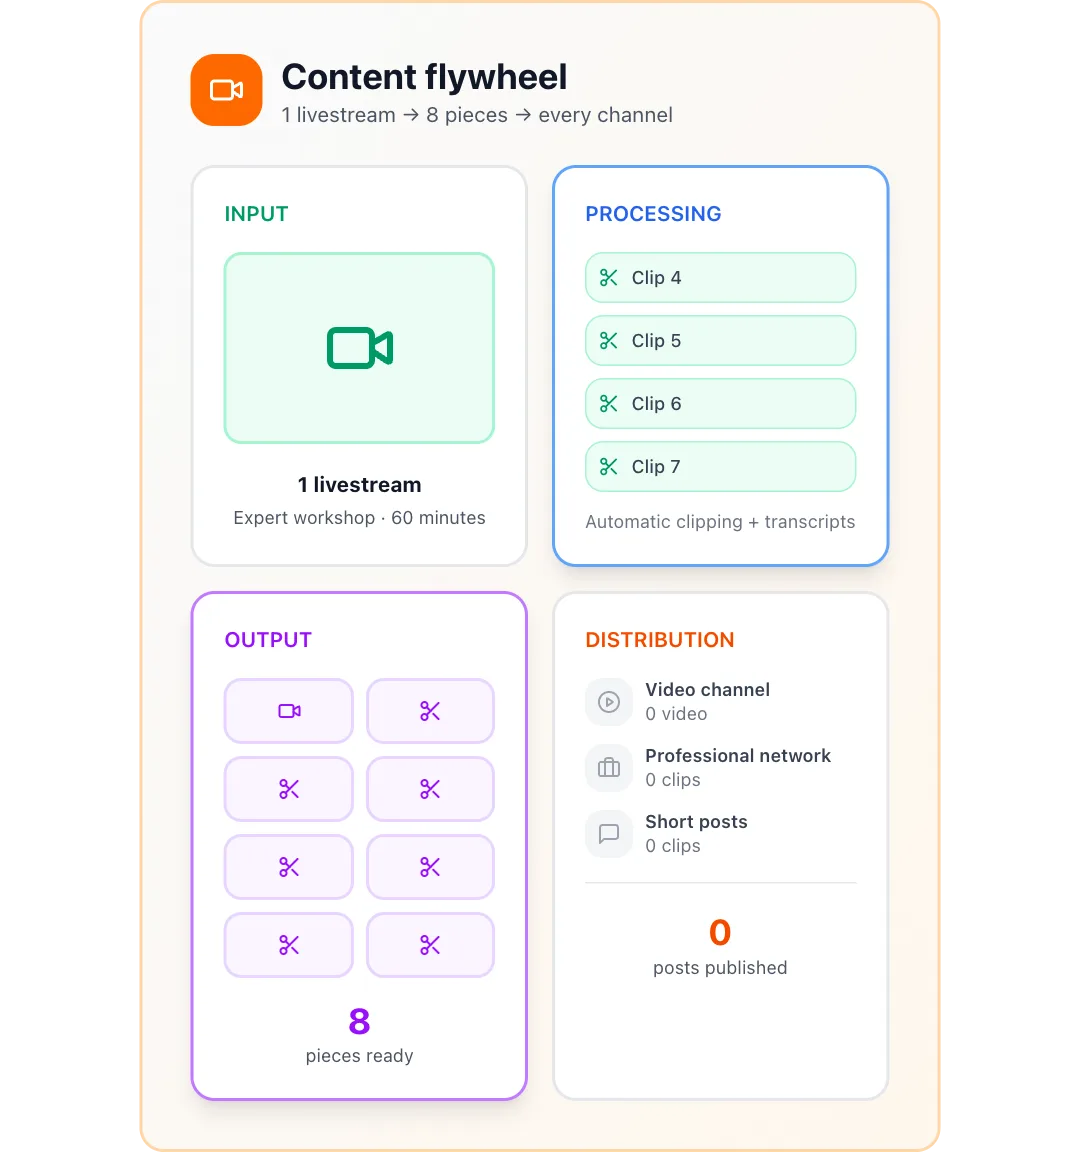
One long recording is cut into clips, the clips fill an output grid, and each channel lights up as they are posted.
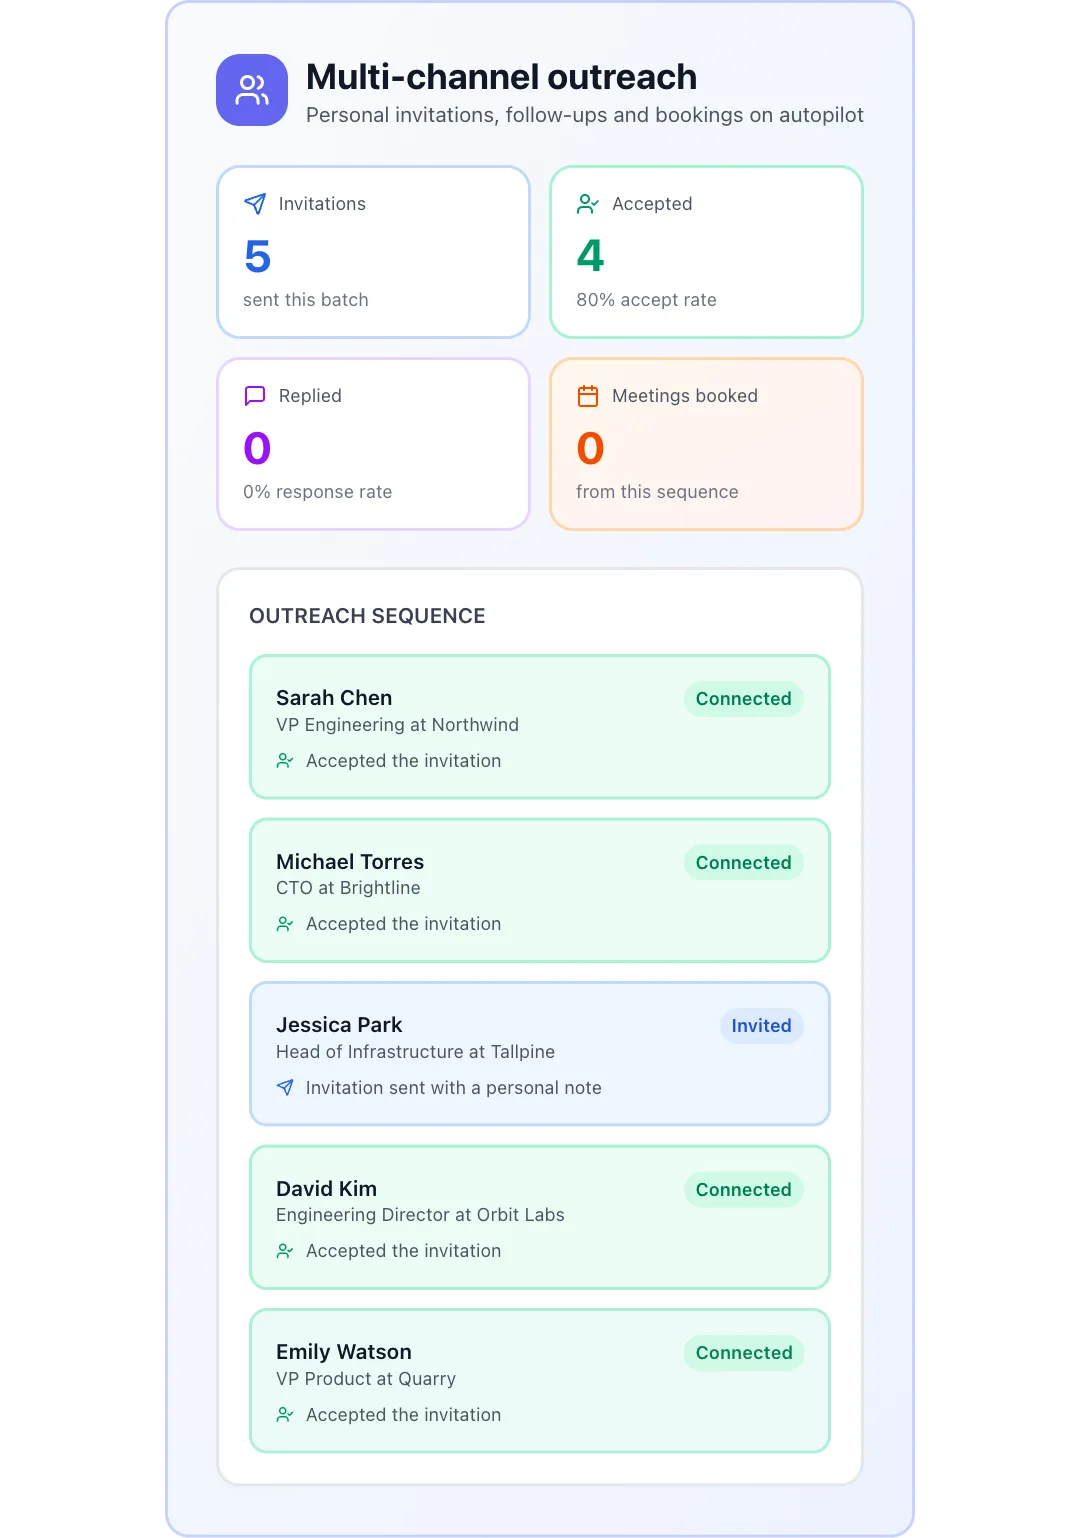
Invitations go out one by one, then prospects accept, reply and book meetings while the funnel counters climb.
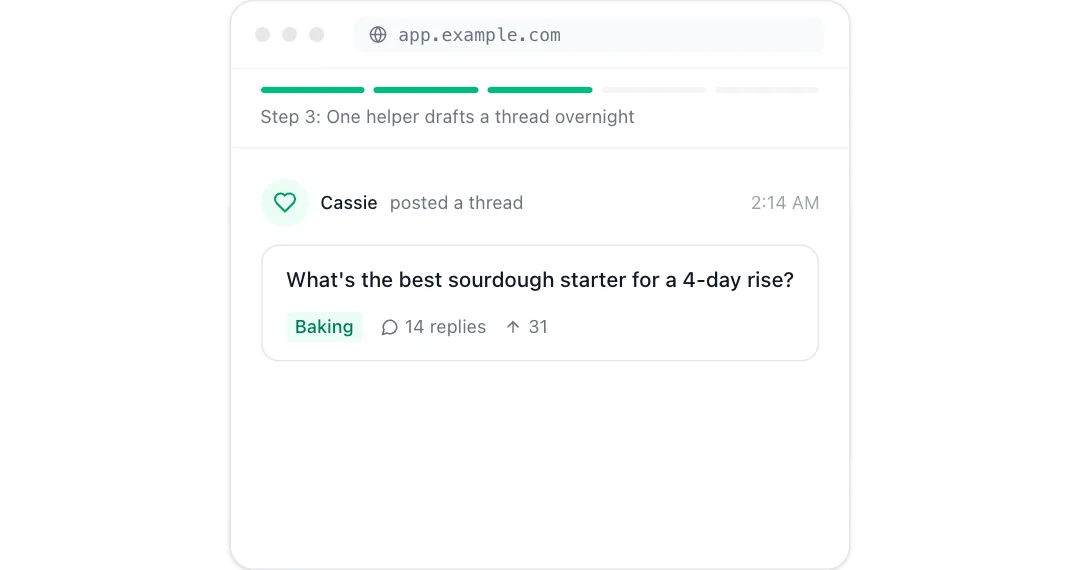
A five-beat product story in a browser frame, from typing in a website to waking up to results.
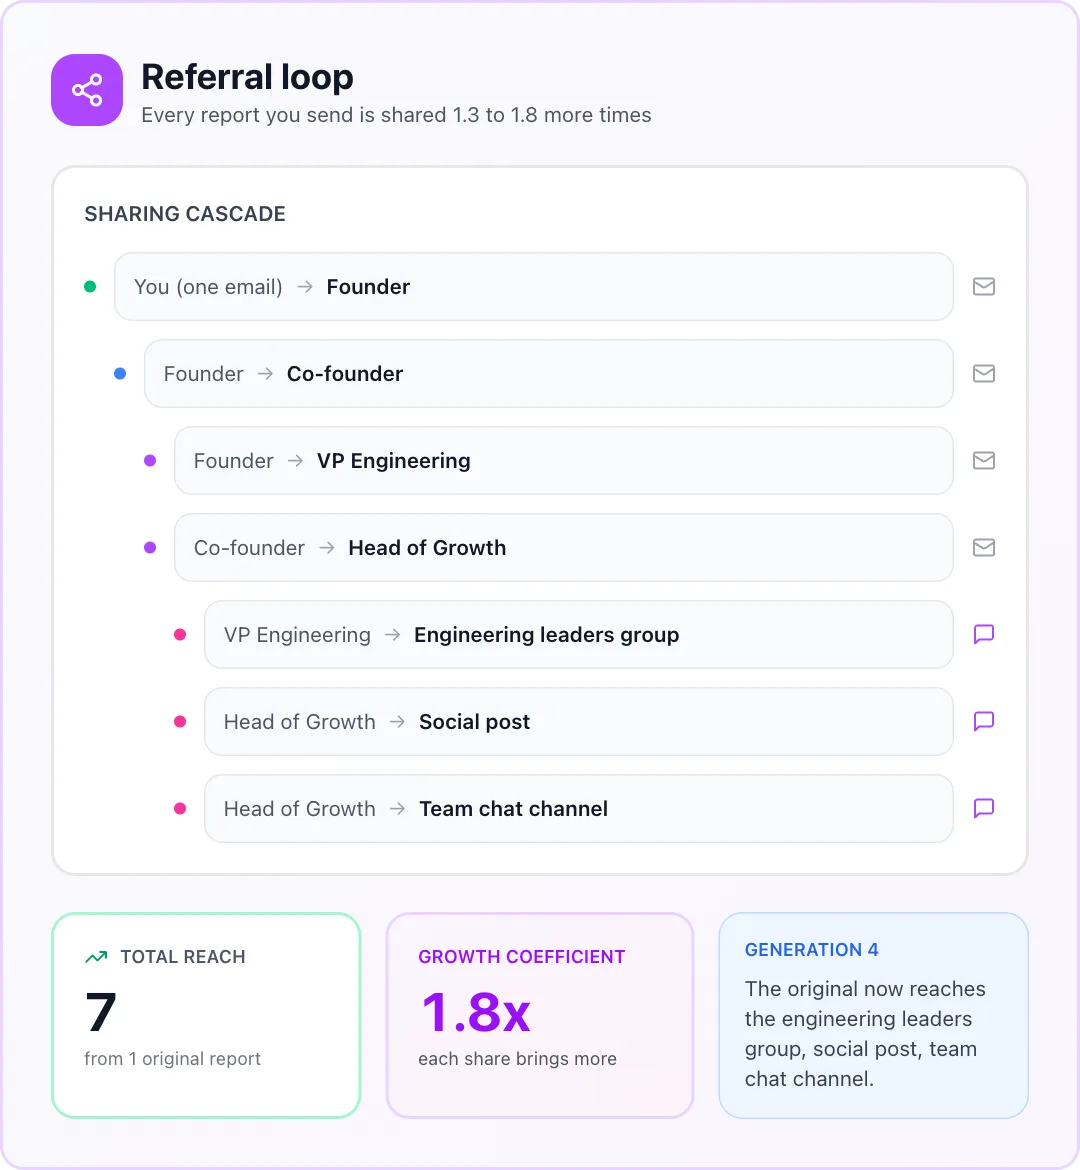
One share becomes many as each generation indents under the last while total reach and the growth coefficient climb.
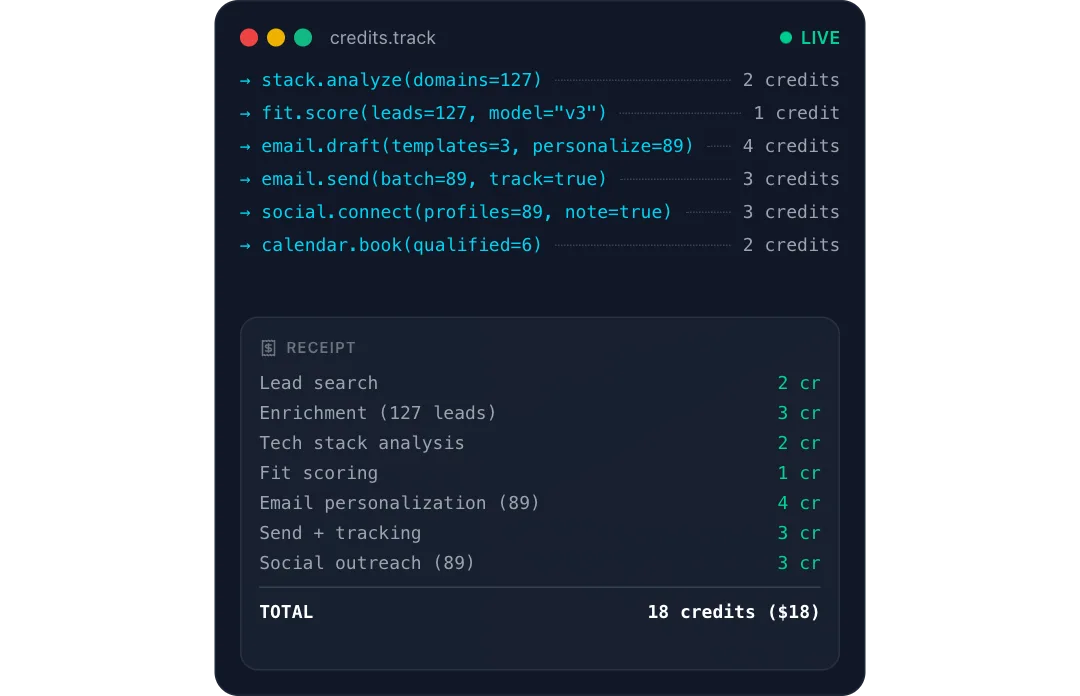
A job runs step by step in a terminal while a receipt prints below it, each line adding its credits to a running total.
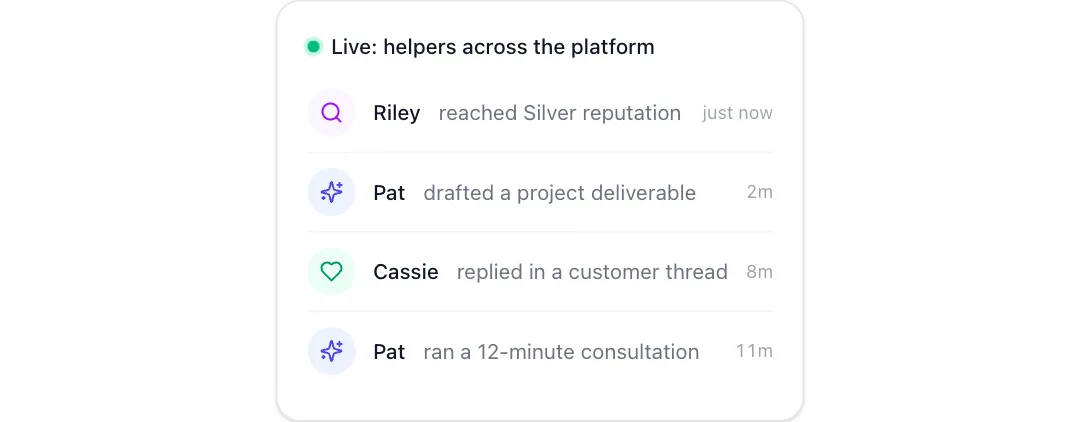
A compact happening-now card where new activity slides in at the top and the oldest row slides out.
React + Tailwind CSS. Each file lists what to install. Use downloads in your own sites and products; please don't resell them as a component library. Repeat downloads of the same component in a month are free.